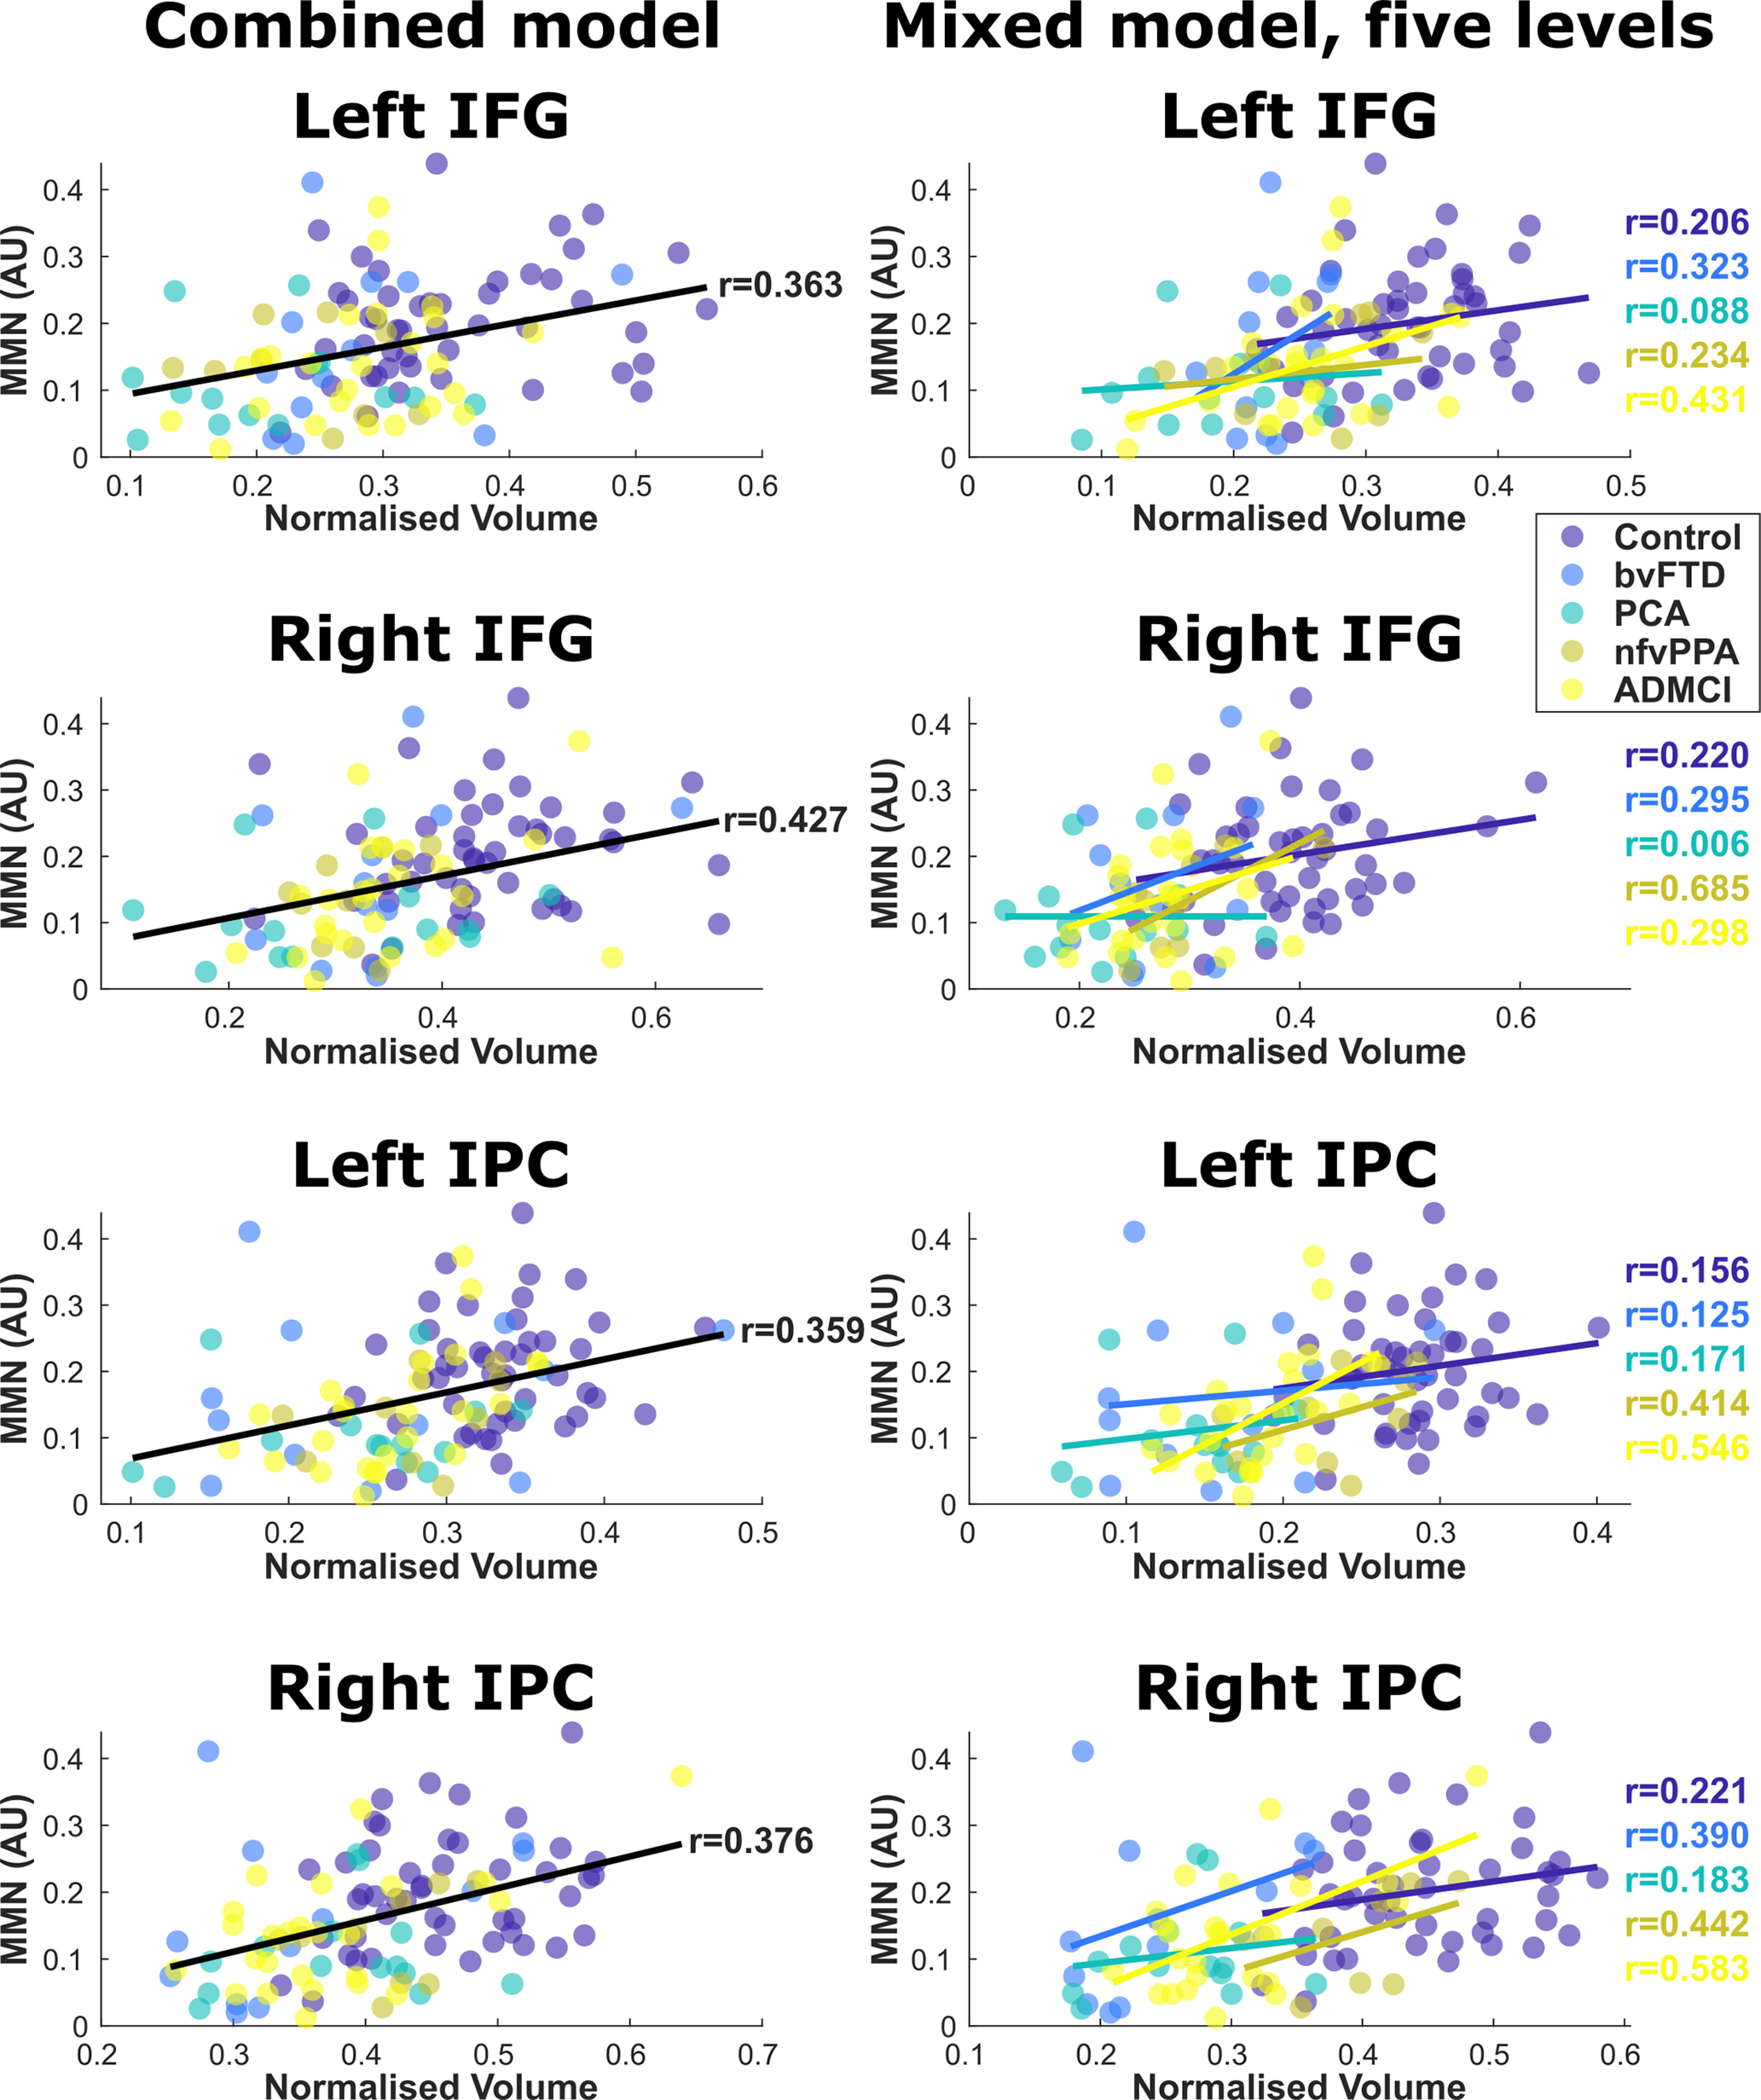
Figure 7.

Regression model datapoints in frontal and parietal hot-spot regions, with individuals color-coded by group. IFG, inferior frontal gyrus; IPC, inferior parietal cortex. The left column shows the combined model with all participants included as a single group, with age and TIV as covariates of no interest. The global trend line is shown. The right column shows the linear mixed model with age and TIV as covariates of no interest and a factor group with five levels, demonstrating similar structure-function relationships in every group individually.
