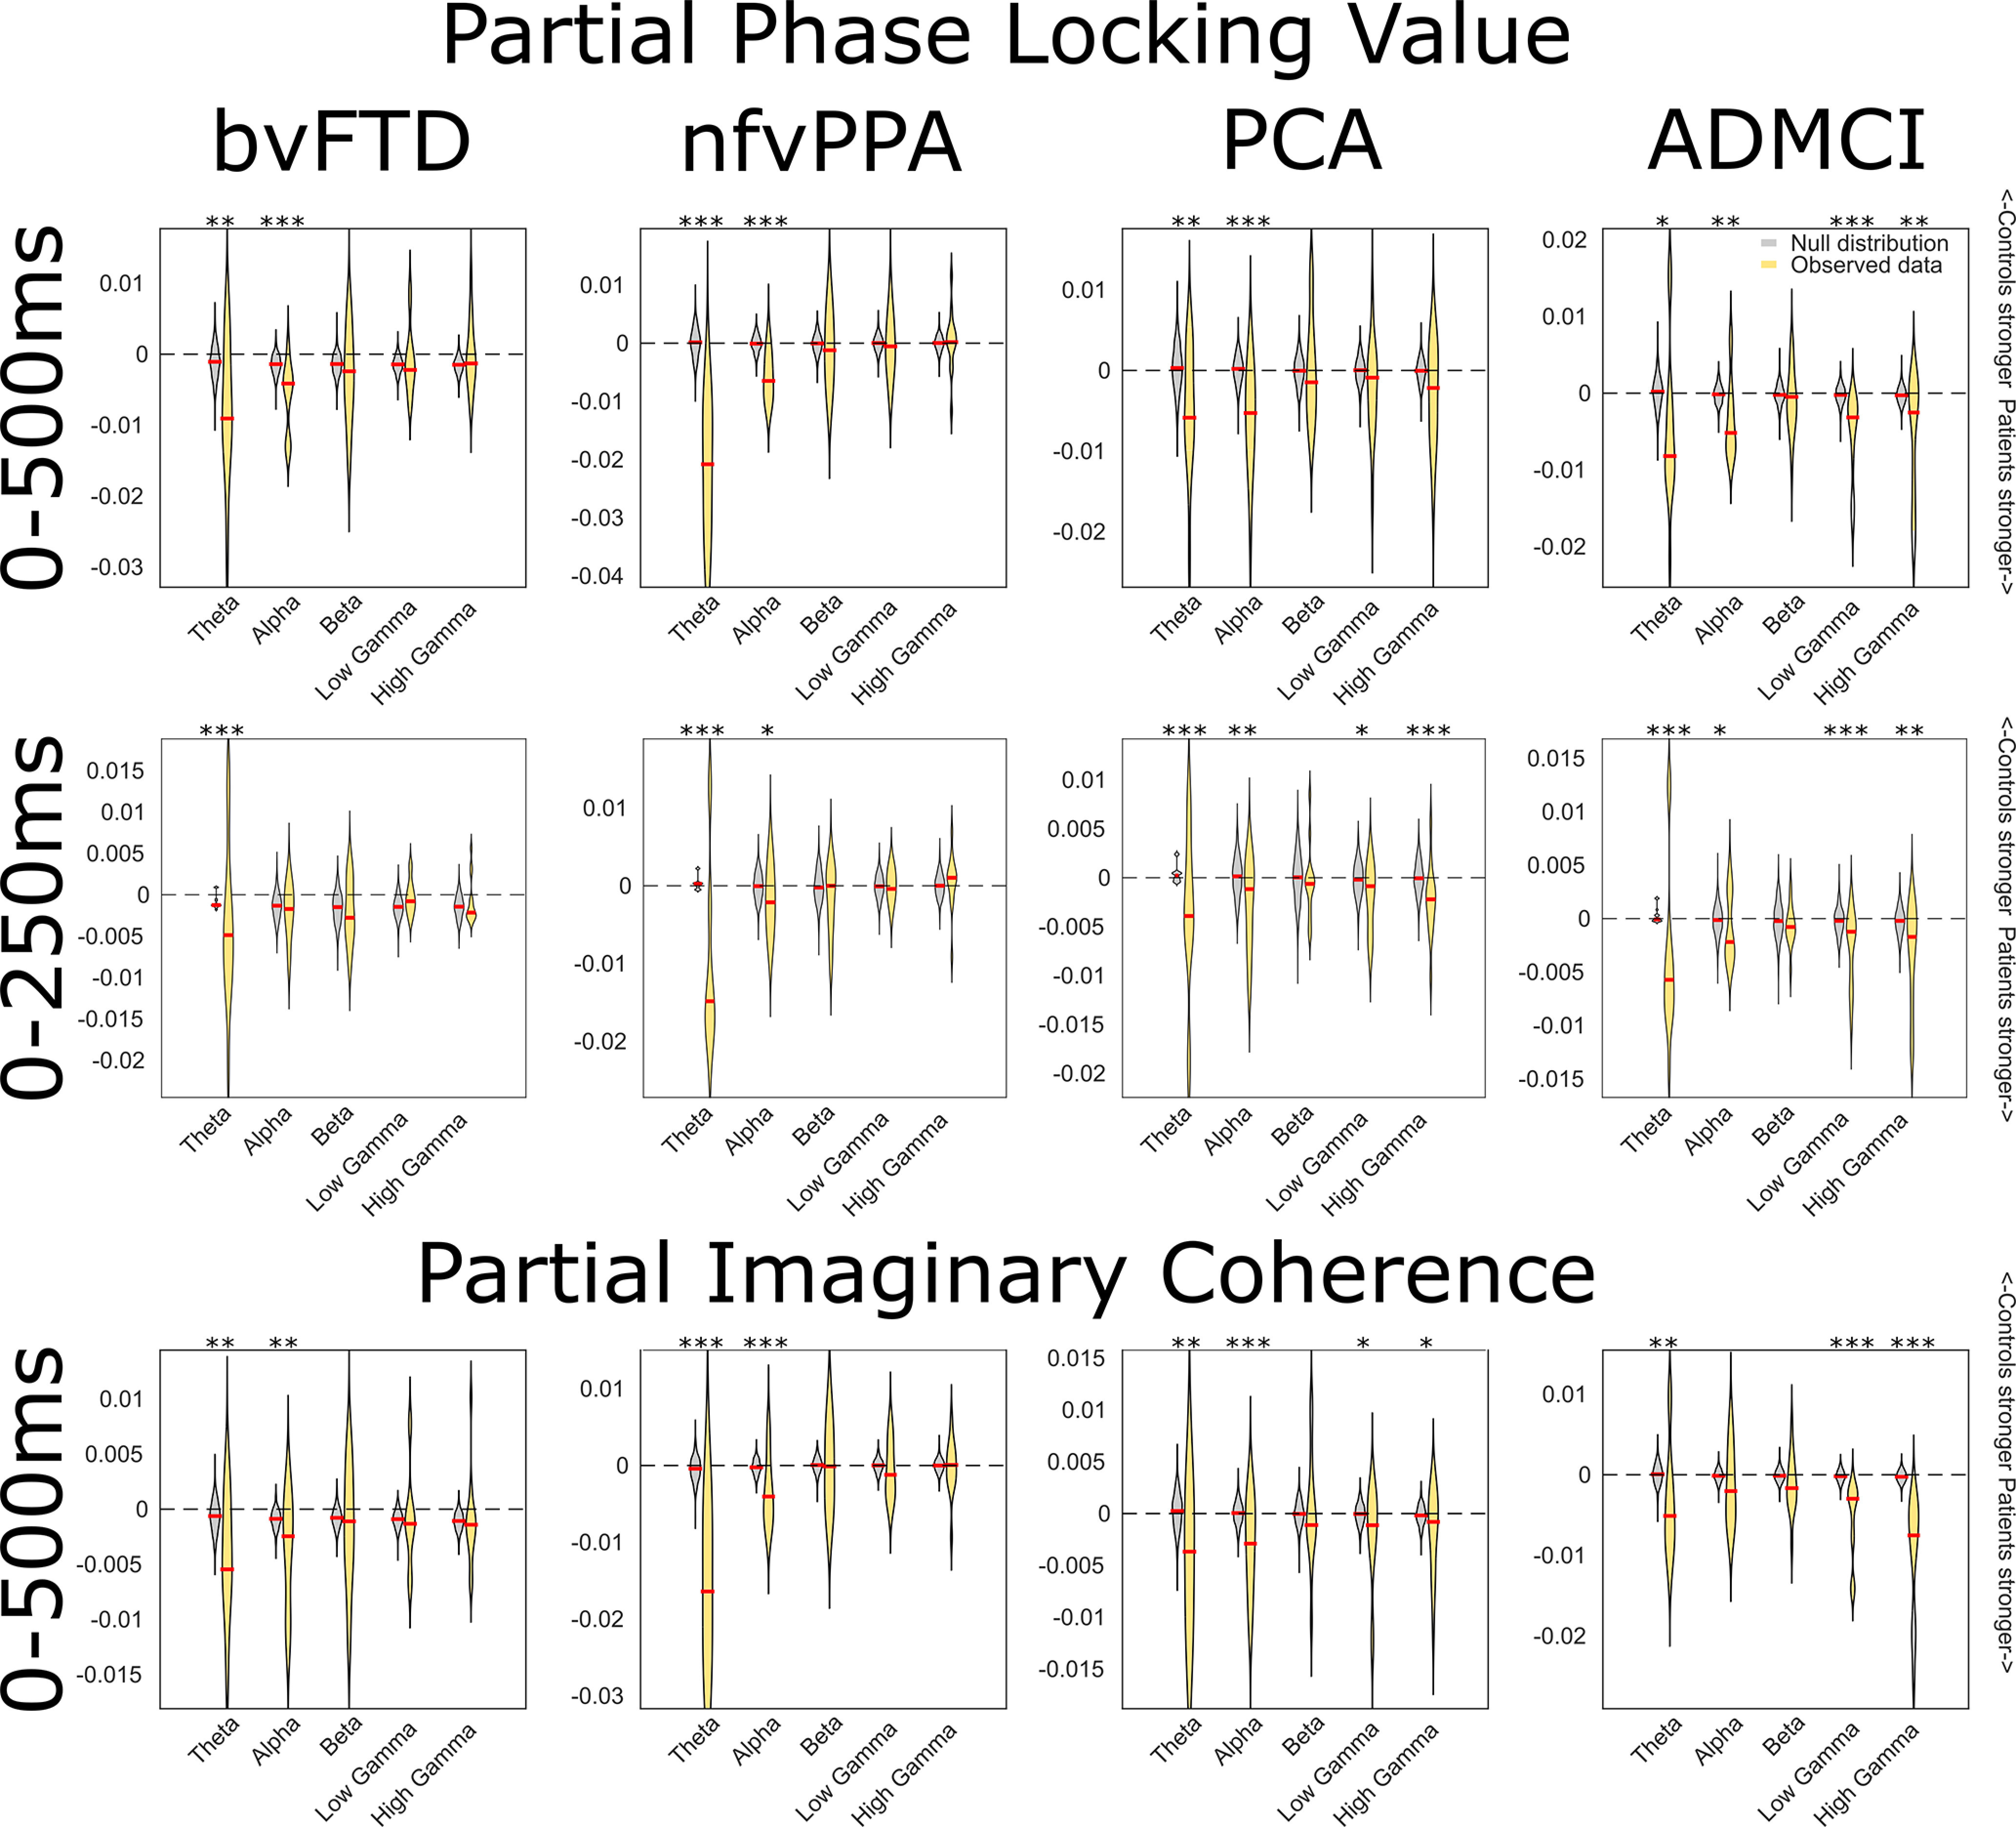
Figure 9.

Frequency resolved connectivity analyses with phase-locking value (plv) and imaginary coherence (icoh). For each frequency band and for each connection, the observed mean plv or icoh in the relevant patient group was subtracted from the same measure in the control group. Negative values indicate stronger plv or icoh in patients than controls. These data were compared with a null distribution of 1100 values for each frequency band (100 iterations at each of 11 unique connections), generated from the same subtraction for trial-shuffled connectivity, using two-sample Welch's t tests. *p < 0.05, **p < 0.01, ***p < 0.001. The pattern of results was similar for continuous data epoched 0–500 ms after tone onset, and discontinuous data focused on the time of the MMN, 0–250 ms after tone onset. These findings cannot be accounted for by overall differences in power between groups; in general, patients had the same or higher functional connectivity, and the same or lower power compared with controls (Fig. 12).
