
FIGURE 4.
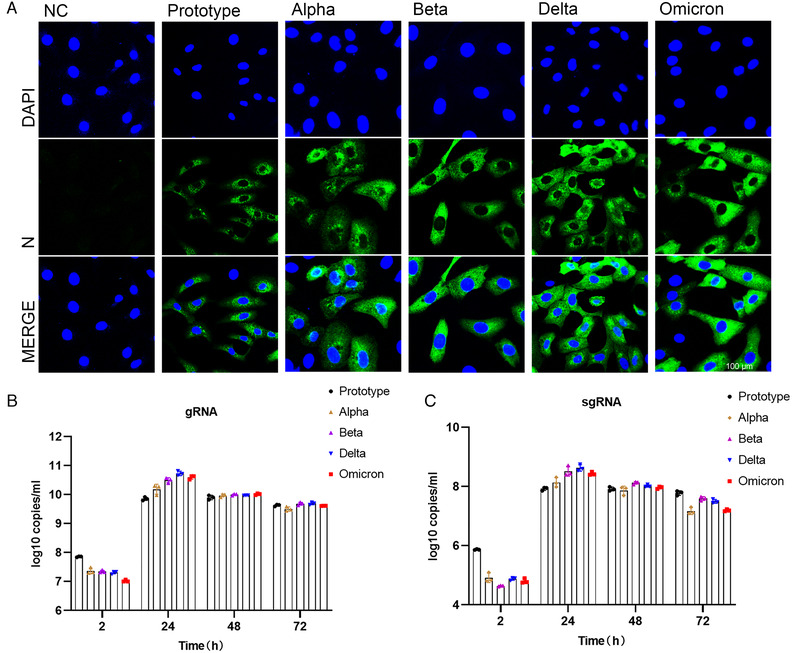
Analysis of Vero cells infected with different SARS‐CoV‐2 variants. (A) Immunofluorescence analysis of viral antigen of different variants in Vero cells 24 h after virus infection. Viral antigen was detected with anti‐N protein antibody. Shot under a 60× confocal microscope. (B) Copy numbers of viral genomes of different variants were measured with N gene by qPCR at 2, 24, 48, and 72 h post virus infection. (C) Subgenome copy number of different variants analyzed by E‐gene via qPCR at 2, 24, 48, and 72 h post virus infection