Figure 5.

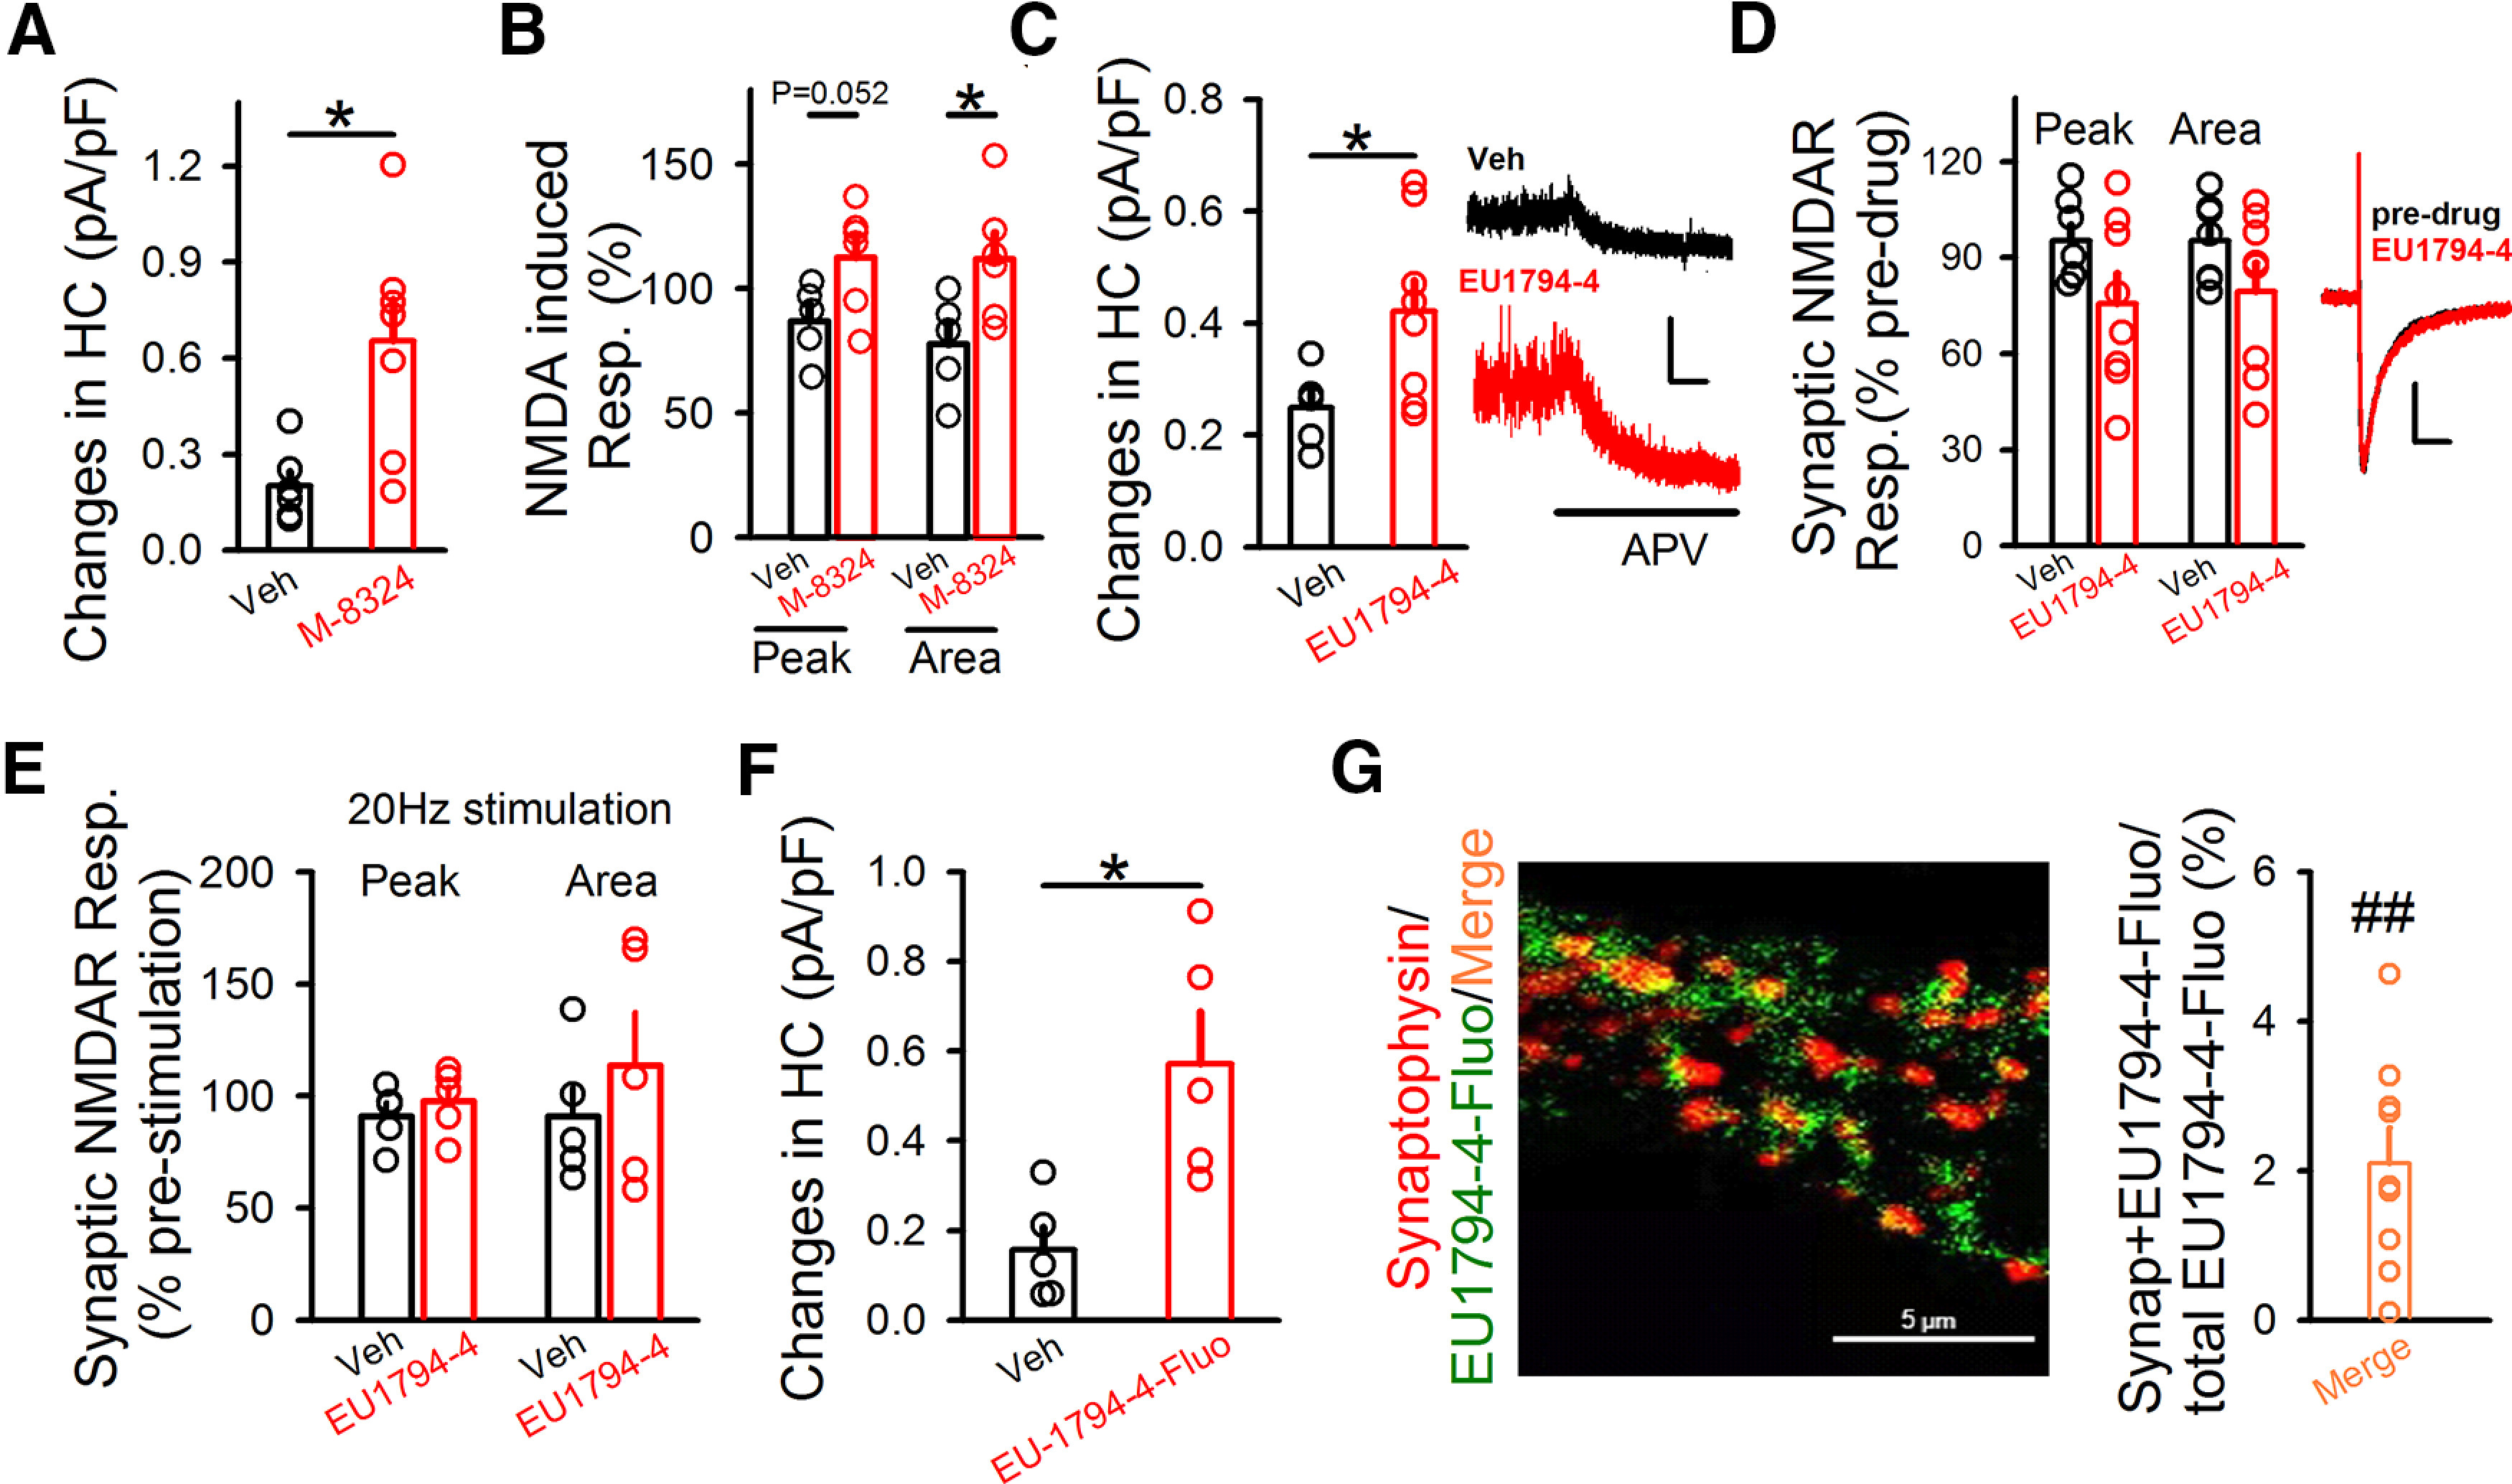
EU1794-4 mostly acts on extrasynaptic NMDARs in GABAergic neurons. A, Ambient NMDAR responses in the presence of M-8324 or vehicle. HC, Holding current with neurons clamped at 40 mV. Veh, 0.20 ± 0.046 pA/pF; N (cells) = 6. M-8324, 0.65 ± 0.13 pA/pF; N (cells) = 7. *p<0.05 (unpaired t test). B, M-8324 increased extrasynaptic NMDAR responses induced by puffed NMDA. Peak and area of puffed NMDA-induced response in the presence of M-8324 or Veh. Veh, Peak, 87 ± 6.77%; Area, 112.62 ± 8.79%; N (cells) = 5. M-8324, Peak, 77.81 ± 8.92%; Area, 112.03 ± 10.28%; N (cells) = 6. *p<0.05 (unpaired t test). C, Ambient NMDAR responses in the presence of EU1794-4 (30 μm) or vehicle, with sample traces on the right. Veh, 0.24 ± 0.03 pA/pF; N (cells) = 5. EU1794-4, 0.42 ± 0.05 pA/pF; N (cells) = 8. Calibration: 10 s, 50 pA. *p<0.05 (unpaired t test). D, EU1794-4's impact on evoked NMDAR-EPSCs, compared with vehicle, with sample traces on the right. Calibration: 100 ms, 20 pA. Peak amplitude, Veh, 95.22 ± 5.01%; EU1794-4, 75.71 ± 9.43%; p = 0.10. Area, Veh, 95.24 ± 4.95%; EU1794-4, 79.46 ± 8.92%; p = 0.16. N (cells) = 7 (Veh), 8 (EU1794-4). E, Activity dependence of EU1794-4 on NMDAR-EPSCs. Neither peak nor area was altered after 20 Hz synaptic stimulation in the presence of EU1794-4 (30 μm). Veh, Peak, 91.17 ± 5.87%; Area, 90.98 ± 13.4%; N (cells) = 5; EU1794-4, Peak, 97.84 ± 6.5%; Area, 113.7 ± 23.58%; N (cells) = 5. F, EU1794-4-Fluo increased extrasynaptic NMDAR responses. Ambient NMDAR responses were significantly larger in the presence of EU1794-4-Fluo (300 μm), compared with the Veh. Veh, 0.15 ± 0.05; N (cells) = 5; EU1794-4-Fluo, 0.57 ± 0.11; N (cells) = 5. *p<0.05 (unpaired t test). G, Left, Staining of EU1794-4-Fluo and synaptophysin on cultured neurons. Representative images of synaptophysin (red), EU1794-4-Fluo (green), and merge between them. Right, Percentage of (synaptophysin + EU1794-4-Fluo)/total EU1794-4-Fluo; 2.09 ± 0.47%, N (cells) = 9. ##p<0.01, compared with fluorescent density of the total EU1794-4-Fluo (paired t test). Data are mean ± SEM.
