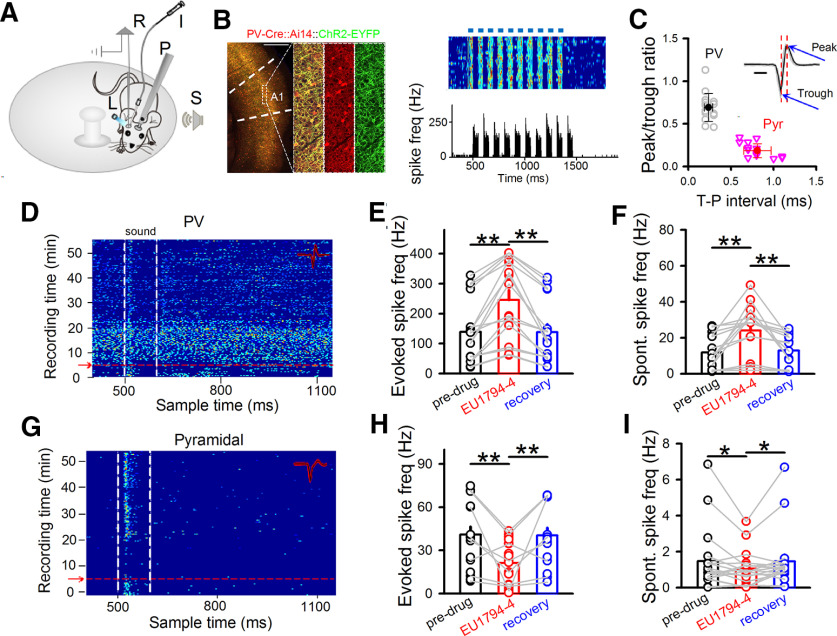
Figure 7.
Impact of EU1794-4 on neuronal spiking in vivo. A, Experimental setup. A mouse was head-fixed via a headpost (P) but could run freely on a rotatable plate. Sound (S) was applied to one ear, and patch recording (R) was performed in the contralateral A1. Blue light (L) and drug infusion tube (I) were positioned next to recording site in A1. B, Left, Confocal images represent tdTomato-labeled PV neurons (red) and expression of ChR2-YFP (green) in a representative brain section. Scale bar, 500 μm. Right top, Raster plot of spikes in a representative PV neuron to pulses of blue LED light stimulation (blue bars, 50 ms each pulse). Right bottom, Corresponding poststimulus spike time histogram. C, Peak/trough amplitude ratio plotted against trough-to-peak (T–P) interval of spike waveform. Each data point represented an individual neuron. Solid symbols represent mean ± SD. Inset, Spike waveforms of a representative PV neuron. Black traces were 20 superimposed spikes. Red dotted vertical lines indicate the timing of trough and peak. Blue arrows point to peak and trough. Peak/trough ratio: Pyr, 0.19 ± 0.08; PV, 0.69 ± 0.16. Trough-peak interval: Pyr, 0.81 ± 0.16; PV, 0.24 ± 0.05. Scale bar, 0.5 ms. D, Noise-evoked responses (raster plots) of PV neurons in A1 before and after EU1794-4 injection (red arrow). Dashed lines indicate the onset and offset of acoustic stimulation. Inset, Twenty randomly selected superimposed spike waveforms. Noise-evoked (E) and spontaneous (F) spike frequency of recorded PV neurons before, 15 min, and recovery after EU1794-4 infusion. N (cells) = 16. **p < 0.01 (one-way repeated-measures ANOVA with Bonferroni test). G-I, Similar to D-F, but for pyramidal neurons. N (cells) = 18. **p< 0.01, *p < 0.05, (one-way repeated-measures ANOVA with Bonferroni test). Data are mean ± SEM.

