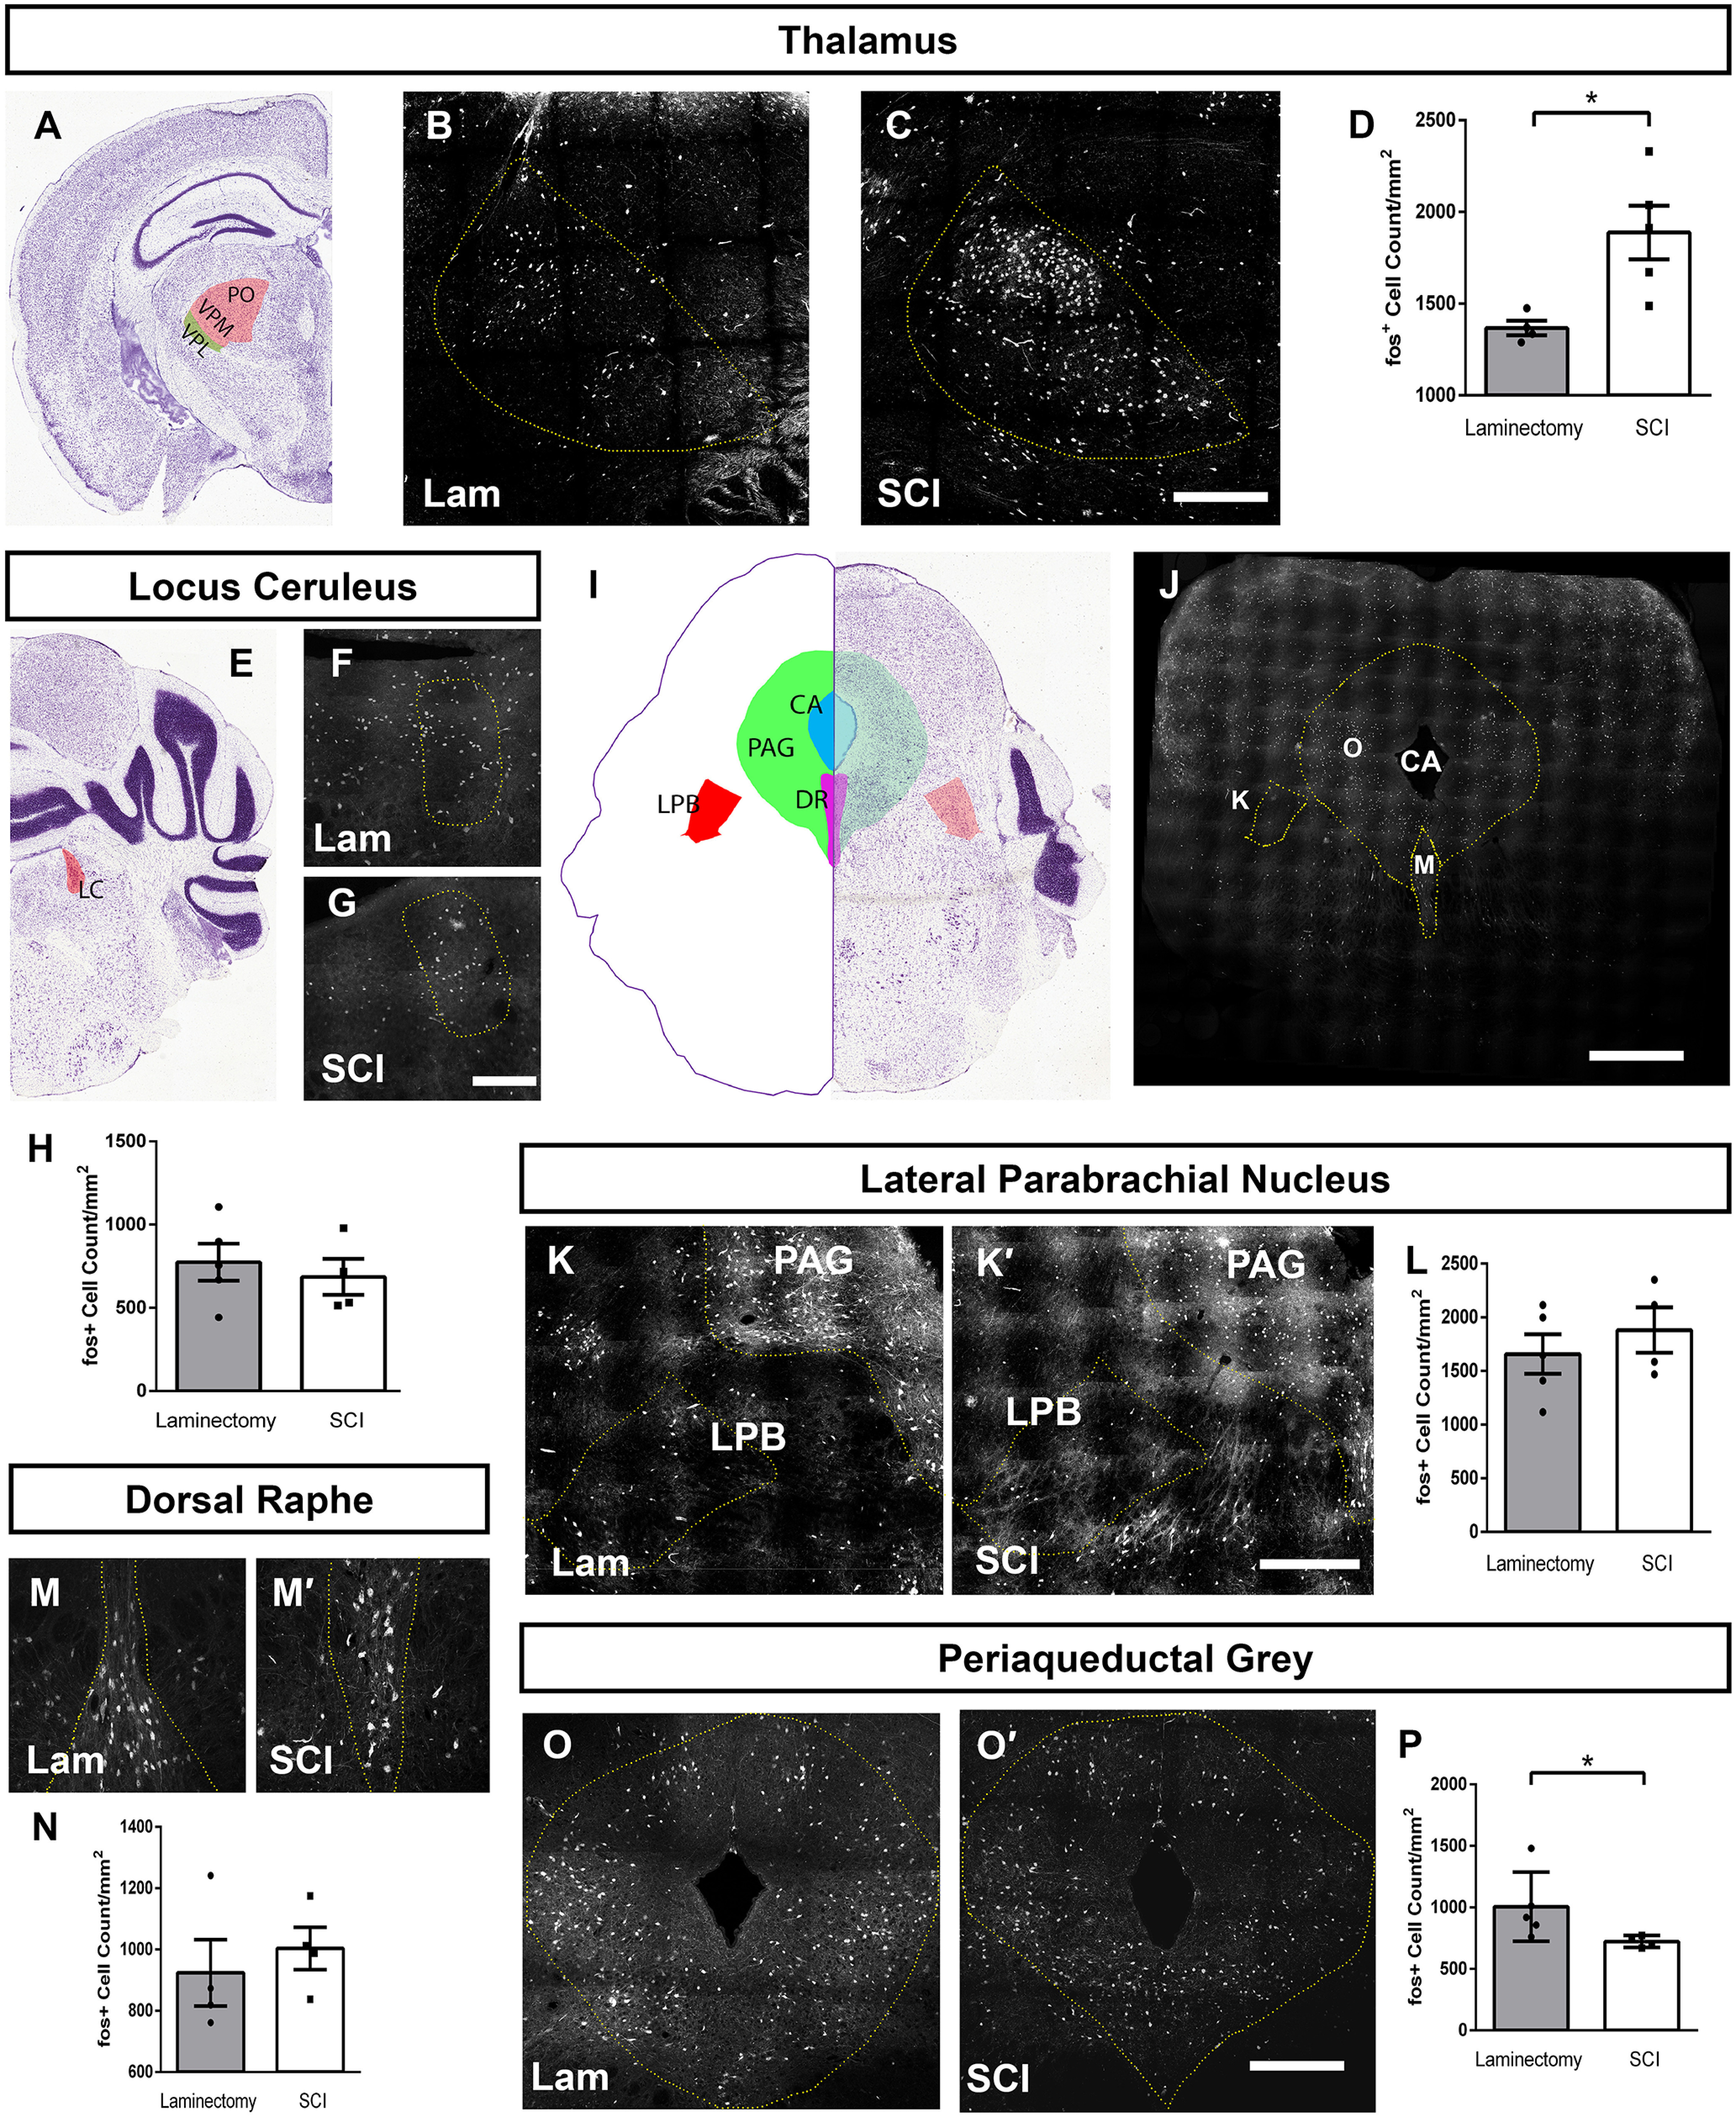
Figure 11.

SCI altered neuron activation in pain processing brain regions. Diagram of the location of thalamus quantification (A). Representative coronal images of thalamus 35 d after laminectomy (B) or contusion (C) with mechanical stimulation; scale bar: 350 µm. Quantification of activated cells in thalamus (D). Diagram of the location of LC quantification (E). Representative coronal LC images following laminectomy (F) or contusion (G); scale Bar: 150 µm. Quantification of activated LC cells (H). Diagram of brainstem cross-section showing locations for quantification of PAG, LPB, and DR. Low magnification of TRAP2 mouse brainstem in cross-section corresponding to diagram in panel I (J); scale bar: 400 µm. Representative coronal images of LPB and PAG following laminectomy (K) or contusion (K'). Quantification of activated cell counts in LPB (L). Representative coronal images of activated cells in DR following laminectomy (M) or contusion (M'); scale bar: 350 µm. Quantification of activated DR neurons (N). Representative coronal images of activated cells in PAG following laminectomy (O) or contusion (O'); scale bar: 250 µm. Quantification of activated cell counts in PAG (P). Image credit for coronal brain images (A,E,I): Allen Institute (2004).
