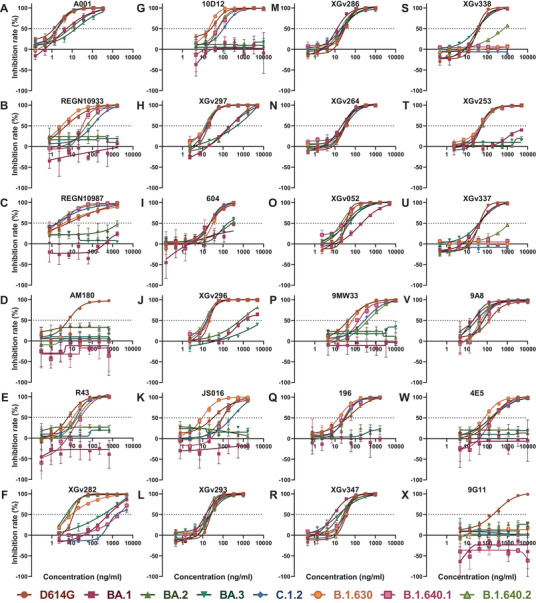
FIGURE 2.

Neutralization curves of monoclonal antibodies (mAbs) against variants. Neutralization curves of 24 mAbs against D614G and seven variant pseudoviruses. The inhibition rate at different mAb concentrations was calculated, and then the neutralization curve data were drawn using GraphPad software. All data are the result of three replicates. The x‐axis is the antibody concentration, the y‐axis represents the inhibition rate of different pseudoviruses, and the dotted line represents the 50% inhibition rate. (A–S) The mAbs A001, REGN10933, REGN10987, AM180, R43, XGv282, 10D12, XGv297, 604, XGv296, JS016, XGv293, XGv286, XGv264, XGv052, 9MW33, 196, XGv347, XGv338, XGv253, XGv337, 9A8, 4E5, and 9G11, respectively. Related to Figure 1
