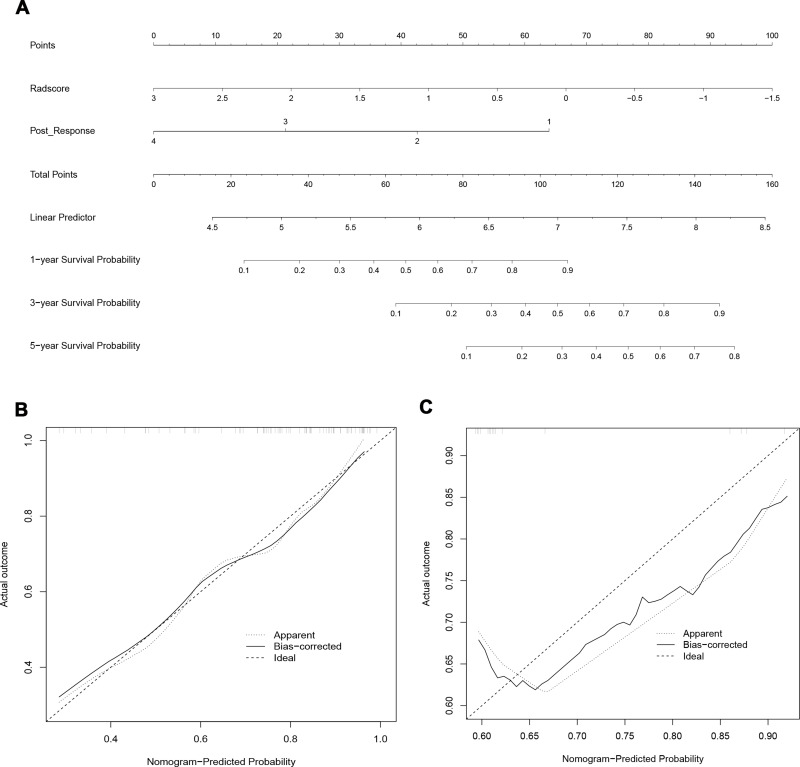
Figure 4.
Development and validation of the model. (A) The nomogram of combined model for predicting overall survival (OS) was consisting of post-response (1= complete response, 2 = partial response, 3 = stable disease, 4 = progressive disease) and radscore, with a C-index of 0.806 (95% CI: 0.697–0.953) in the training cohort. The calibration curve demonstrating predictions from the model to the actual observed probability in the training cohort (B) and validation cohort (C).

