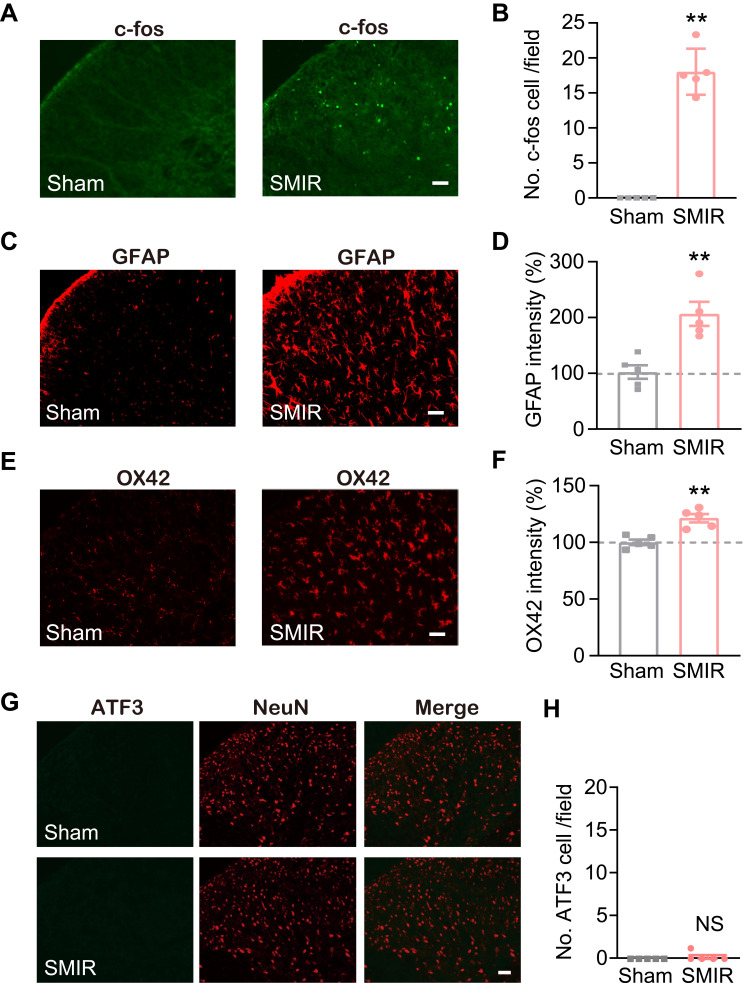
Figure 2.
Ipsilateral SCDH of SMIR model rats showed remarkable glial cell overactivation and c-Fos immunoreactivity, but no neuronal damage. (A) Representative immunofluorescence pictures showing c-Fos staining of ipsilateral SCDH from SMIR and sham group of rats. (B) Summary of c-Fos positively stained cell numbers in SMIR and sham groups. (C) Representative immunofluorescence pictures showing GFAP (an astrocytic marker) antibody staining of ipsilateral SCDH from SMIR and sham groups. (D) Normalized percentage increase in GFAP immunostaining intensity in SMIR and sham groups. (E) Representative immunofluorescence pictures showing OX42 (a microglia marker) antibody staining of ipsilateral SCDH from SMIR and sham groups. (F) Normalized percentage increase in OX42 immunostaining intensity in SMIR and sham groups. (G) Representative immunofluorescence images showing ATF3 (a neuronal damage marker) antibody staining of ipsilateral SCDH from SMIR and sham groups. NeuN is used for the labelling of neurons. (H) Summarized data showing ATF3 positively stained cell numbers in SMIR and sham groups. Scale bar indicates 50 μm. **p < 0.01 vs sham group. n = 5 rats/group.
Abbreviation: NS, no significance.

