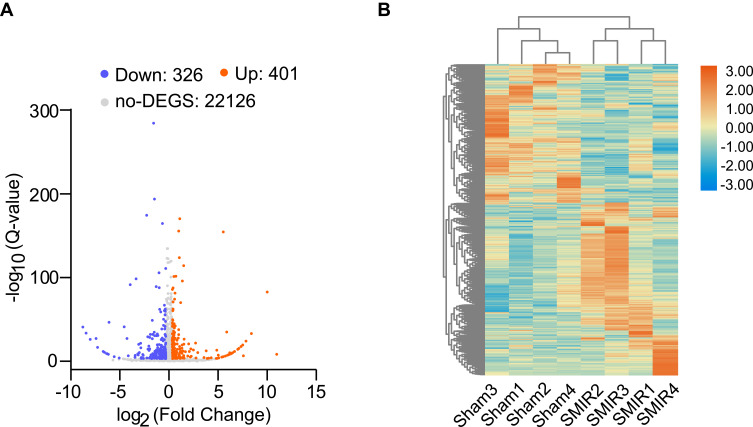
Figure 3.
Genome-wide expression profiling through RNA-Seq of ipsilateral SCDH from SMIR model and sham group of rats. (A) Gene expression profiles of SMIR model group vs sham group shown by volcano graphs. Red and blue spots indicate up- and down-regulated DEGs. Grey spots indicate non-DEGs. (B) Heatmap showing DEGs and hierarchical clustering analysis of the DEGs. n = 4 rats/group.

