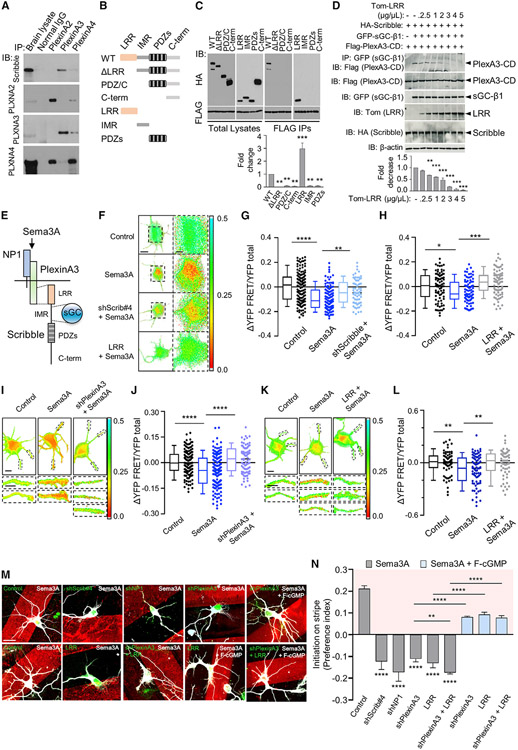
Figure 1. Sema3A mediates cGMP increase and dendrite development via PlexinA3-Scribble association.
(A) Co-immunoprecipitation (co-IP) of Scribble with PlexinA2, PlexinA3, or PlexinA4 from rat E18 embryonic brain lysates. Immunoprecipitation (IP) with antibody (Ab) to PlexinA2, PlexinA3, or PlexinA4, and immunoblotting (IB) with Ab to Scribble. IB also with Abs to PlexinA2, PlexinA3, or PlexinA4 to detect their expression. IP with non-specific IgG, control (normal IgG). “Brain lysate,” total brain lysate (n = 3). PlexinA3 co-precipitated Scribble. IB with PlexinA Abs confirmed that absence of Scribble association with PlexinA2 or PlexinA4 was not due to lack of protein expression. IB for PlexinA2, PlexinA3, or PlexinA4 showed cross-reactivity among Abs for PlexinA2 and PlexinA4, but not PlexinA3, reinforcing specificity of Scribble-PlexinA3 association (see Figure S1A).
(B) Schematics of wild-type (WT) Scribble and deletion mutants. WT-Scribble contains 16 N-terminal leucine-rich repeats (LRRs) followed by four PDZ domains, separated by an intermediate region (IMR). Deletion mutants included those in which LRR (ΔLRR), LRR and IMR (PDZ/C), or all three regions, LRR, IMR, and PDZ (C-term) were deleted; variants of isolated LRR (LRR), IMR (IMR), or PDZ domains (PDZs). Scribble proteins fused to HA tag (Szczurkowska et al., 2020).
(C) Co-IP of PlexinA3 cytoplasmic domain (PlexinA3-CD) with WT or mutant Scribble variants from HEK-293 cell lysates co-expressing FLAG-PlexinA3-CD with HA-Scribble mutants (B). IP, FLAG; IB, HA (right two panels). “Total Lysates,” total cell lysates (left two panels): IB, FLAG, or HA. Association of FLAG-PlexinA3-CD with HA-Scribble mutants quantified as fold change (n = 3, one-way ANOVA, Dunnett’s multiple comparison test: **p ≤ 0.01; ***p ≤ 0.001) relative to WT-Scribble, normalized to total respective protein levels (see Figures S1B, S1C, and S2C).
(D) Co-IP of PlexinA3-CD with sGC-β1 in presence of Scribble from HEK-293 cell lysates co-expressing FLAG-PlexinA3-CD and GFP-sGC-β1, with WT-HA-Scribble, in presence of increasing concentration (0 up to 5 μg/μL) of dTom-LRR, to test PlexinA3-sGC-β1 association in presence of WT-Scribble, and its disruption in presence of increasing LRR concentration. IP, GFP (sGC-β1); IB, FLAG (PlexinA3-CD). Total cell lysates, IB, FLAG (PlexinA3-CD), GFP (sGC-β1), HA (Scribble), or Tom (LRR), to check protein expression. FLAG-PlexinA3-CD IP with GFP-sGC-β1, in presence of dTom-LRR, quantified as fold change (n = 3, one-way ANOVA; Dunnett’s multiple comparison test: **p ≤ 0.01; ***p ≤ 0.001) relative to cells not expressing dTom-LRR, normalized to total FLAG-PlexinA3-CD levels. β-Actin, loading control.
(E) Schematics of Sema3A signaling mediated by NP-1 that binds Sema3A and Plexin co-receptors mediating intracellular signaling. Depicted are PlexinA3 and sGC-β1 binding sites in Scribble, LRR, and IMR, respectively.
(F) Representative images of normalized somatic FRET (YFP-FRET/YFP-total)for control, Scribble-shRNA (shScrib#4), or LRR-expressing cultured hippocampal neurons, co-expressing cGMP FRET probe cGi-500, upon recombinant Sema3A (5 nM) treatment. Control, not treated with Sema3A. Scale bar, 10 μm. Right: higher-magnification images of boxed regions on left. Scale bar, 5 μm. FRET decrease upon Sema3A treatment reflects cGMP increase.
(G and H) Summary of difference in normalized somatic FRET (ΔYFP-FRET/YFP-total) compared with average of control for shScrib#4 (G) or dTom-LRR (H) transfected cells upon Sema3A treatment. Control, not treated with Sema3A (n = 3–4 cultures, 20–30 cells each; one-way ANOVA, Šídák’s multiple comparison test: *p ≤ 0.05; **p ≤ 0.01; ***p ≤ 0.001; ****p ≤ 0.0001) (see Figure S2).
(I and K) Representative images of normalized dendritic FRET (YFP-FRET/YFP-total), for control, PlexinA3-shRNA (I; shPlexinA3), or LRR (K) transfected neurons, co-expressing cGi-500, upon Sema3A treatment. Control, not treated with Sema3A. Scale bar, 10 μm. Bottom: higher-magnification images of individual dendrites (boxed regions in top panels). Scale bar, 5 μm.
(J and L) Summary of difference in normalized dendritic FRET (ΔYFP-FRET/YFP-total) compared with average of control for shPlexinA3 (J) or dTom-LRR (L) transfected neurons upon Sema3A treatment. Control, not treated with Sema3A (n = 3–4 cultures, 20–30 cells each; one-way ANOVA, Šídák’s multiple comparison test: **p ≤ 0.01; ****p ≤ 0.0001; L, LRR + Sema3A, **p = 0.0164).
(M) Representative images of cultured hippocampal neurons transfected with shRNAs for NP-1 (shNP-1), PlexinA3 (shPlexinA3), Scribble (shScrib#4), control-shRNA, or EGFP-LRR or control vector, or co-expressing shPlexinA3 and LRR, plated on Sema3A stripes, alone or together with membrane-permeable fluorescent analog of cGMP (F-cGMP), following immunostaining with Tuj-1 at 5 DIV. Shown are neurons with soma located at stripe boundary. Scale bar, 20 μm.
(N) Quantification of preferential dendrite initiation “on” Sema3A stripe, patterned alone or together with F-cGMP, presented as preference index (PI): [(% dendrites initiated on stripe) – (% dendrites initiated off stripe)]/100, for neurons with soma located on stripe boundary, examined at 5 DIV, transfected as in (M). PI value of 0 indicates equal preference for dendrite formation “on” or “off” stripe (n = 3–5 cultures, 35–75 cells each; one-way ANOVA, Dunnett’s multiple comparison test: ****p ≤ 0.0001; rescue with F-cGMP, one-way ANOVA, Tukey’s multiple comparison test: ****p ≤ 0.0001; shPlexinA3 versus shPlexinA3 + LRR, unpaired t test, **p = 0.0159) (see Figure S3).
*p ≤ 0.05; **p ≤ 0.01; ***p ≤ 0.001; ****p ≤ 0.0001. Error bars represent SEM.

