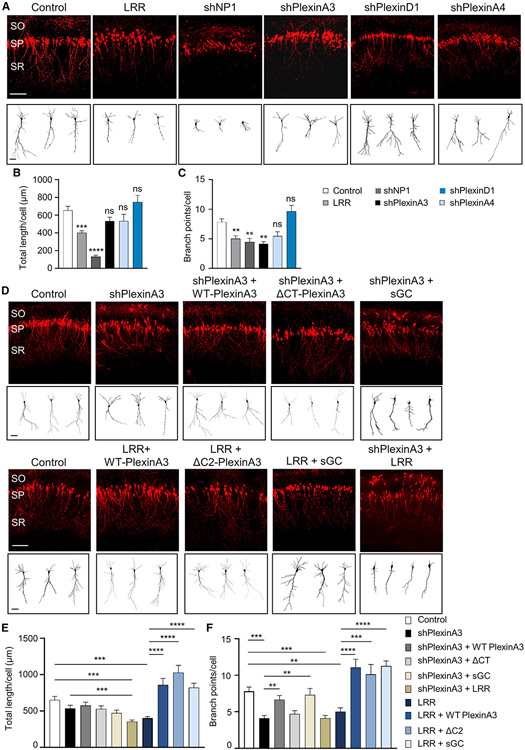
Figure 3. PlexinA3-Scribble association is necessary for CA1 apical dendrite development.
(A and D) Representative images of rat CA1 pyramidal neurons, P7, transfected in utero at E17.5 with shRNA for PlexinA3 (shPlexinA3), NP-1 (shNP-1), PlexinA4 (shPlexinA4), or PlexinD1 (shPlexinD1), or LRR, or control vector (A). Neurons co-transfected with WT-PlexinA3, PlexinA3-ΔC2 (associated Scribble; Figure S5), or PlexinA3-ΔCT (did not associate Scribble; Figure S5), or functional sGC (co-expressing sGC-α1 and -β1 subunits) (D). Neurons also co-transfected with shPlexinA3 and LRR (shPlexinA3 + LRR) (D). Neurons co-transfected with dTom marker. SO, SP, and SR layers as in Figure 2A. Scale bar, 100 μm. Bottom: sample tracings of neuritic arbor of representative neurons. Scale bar, 20 μm (see Figures S5 and S3).
(B and E) Quantification of average total apical dendrite length per cell for CA1 pyramidal neurons transfected as in (A) and (D) (n = 20–52 cells; data for control, shPlexinA3, and LRR were pooled among B and E). Control versus LRR or shPlexinA3 + LRR, one-way ANOVA, Dunnett’s multiple comparison test: ***p ≤*** 0.001; all other conditions, one-way ANOVA, Tukey’s multiple comparison test: ***p ≤ 0.001; ****p ≤ 0.0001. Data for shPlexinA3, shPlexinA4, and shPlexinD1 were not significantly different (ns) from control.
(C and F) Quantification of average total apical dendrite branch points per cell; same dataset as in (B) and (E). Data for Control, shPlexinA3, and LRR were pooled among (C) and (F). Control versus shPlexinA3, LRR, or shPlexinA3 + LRR, one-way ANOVA, Dunnett’s multiple comparison test: **p ≤ 0.01; ***p ≤ 0.001; all other conditions, one-way ANOVA, Tukey’s multiple comparison test: **p ≤ 0.01; ***p ≤ 0.001; ****p ≤ 0.0001; shPlexinA3 versus shPlexinA3 + WT-PlexinA3, Student’s t test, **p ≤ 0.01; data for shPlexinA4 or shPlexinD1 were not significantly different (ns) from control.
**p ≤ 0.01; ***p ≤ 0.001; ****p ≤ 0.0001. Error bars represent SEM.

