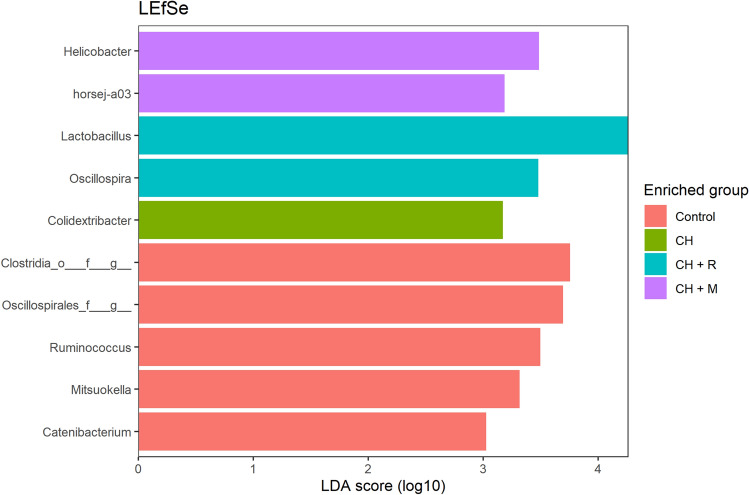
Figure 2.
Barplot of Linear discriminant analysis (LDA) effect size (LEfSe). Horizontal bars represent the effect size for each taxon. The length of the bar represents the LDA score. LDA threshold score for discriminative features was set to 3.0. Dietary treatments: Control = control diet; CH = Chlorella vulgaris diet; CH + R = C. vulgaris diet supplemented with Rovabio® Excel AP; CH + M = C. vulgaris diet supplemented with a pre-selected enzymatic mixture.

