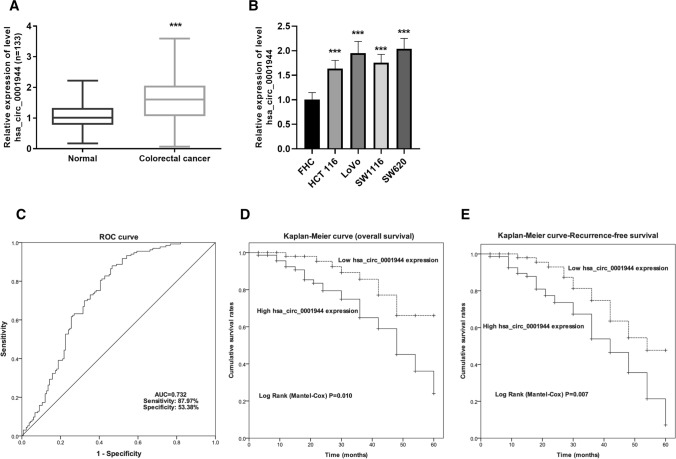
Fig. 1.
A significant increase of hsa_circ_0001944 was discovered in CRC and related to CRC poor prognosis. A Quantification of relative hsa_circ_0001944 in tissues (n = 133) normalized to GAPDH. Paired t test was applied. ***P < 0.001. B Quantification of relative hsa_circ_0001944 in cells normalized to GAPDH. One way analysis of variance was applied. Error bars are mean ± standard error from five replicate samples. ***P < 0.001. C ROC curve for cutoff value of hsa_circ_0001944 for survival. D OS was estimated using the Kaplan–Meier method, with the difference between high- and low-hsa_circ_0001944 groups compared by log-rank test. (P = 0.010). E RFS was estimated using the Kaplan–Meier method, with the difference between high- and low-hsa_circ_0001944 groups compared by log-rank test. (P = 0.007). CRC colorectal cancer, OS overall survival, RFS recurrence-free survival

