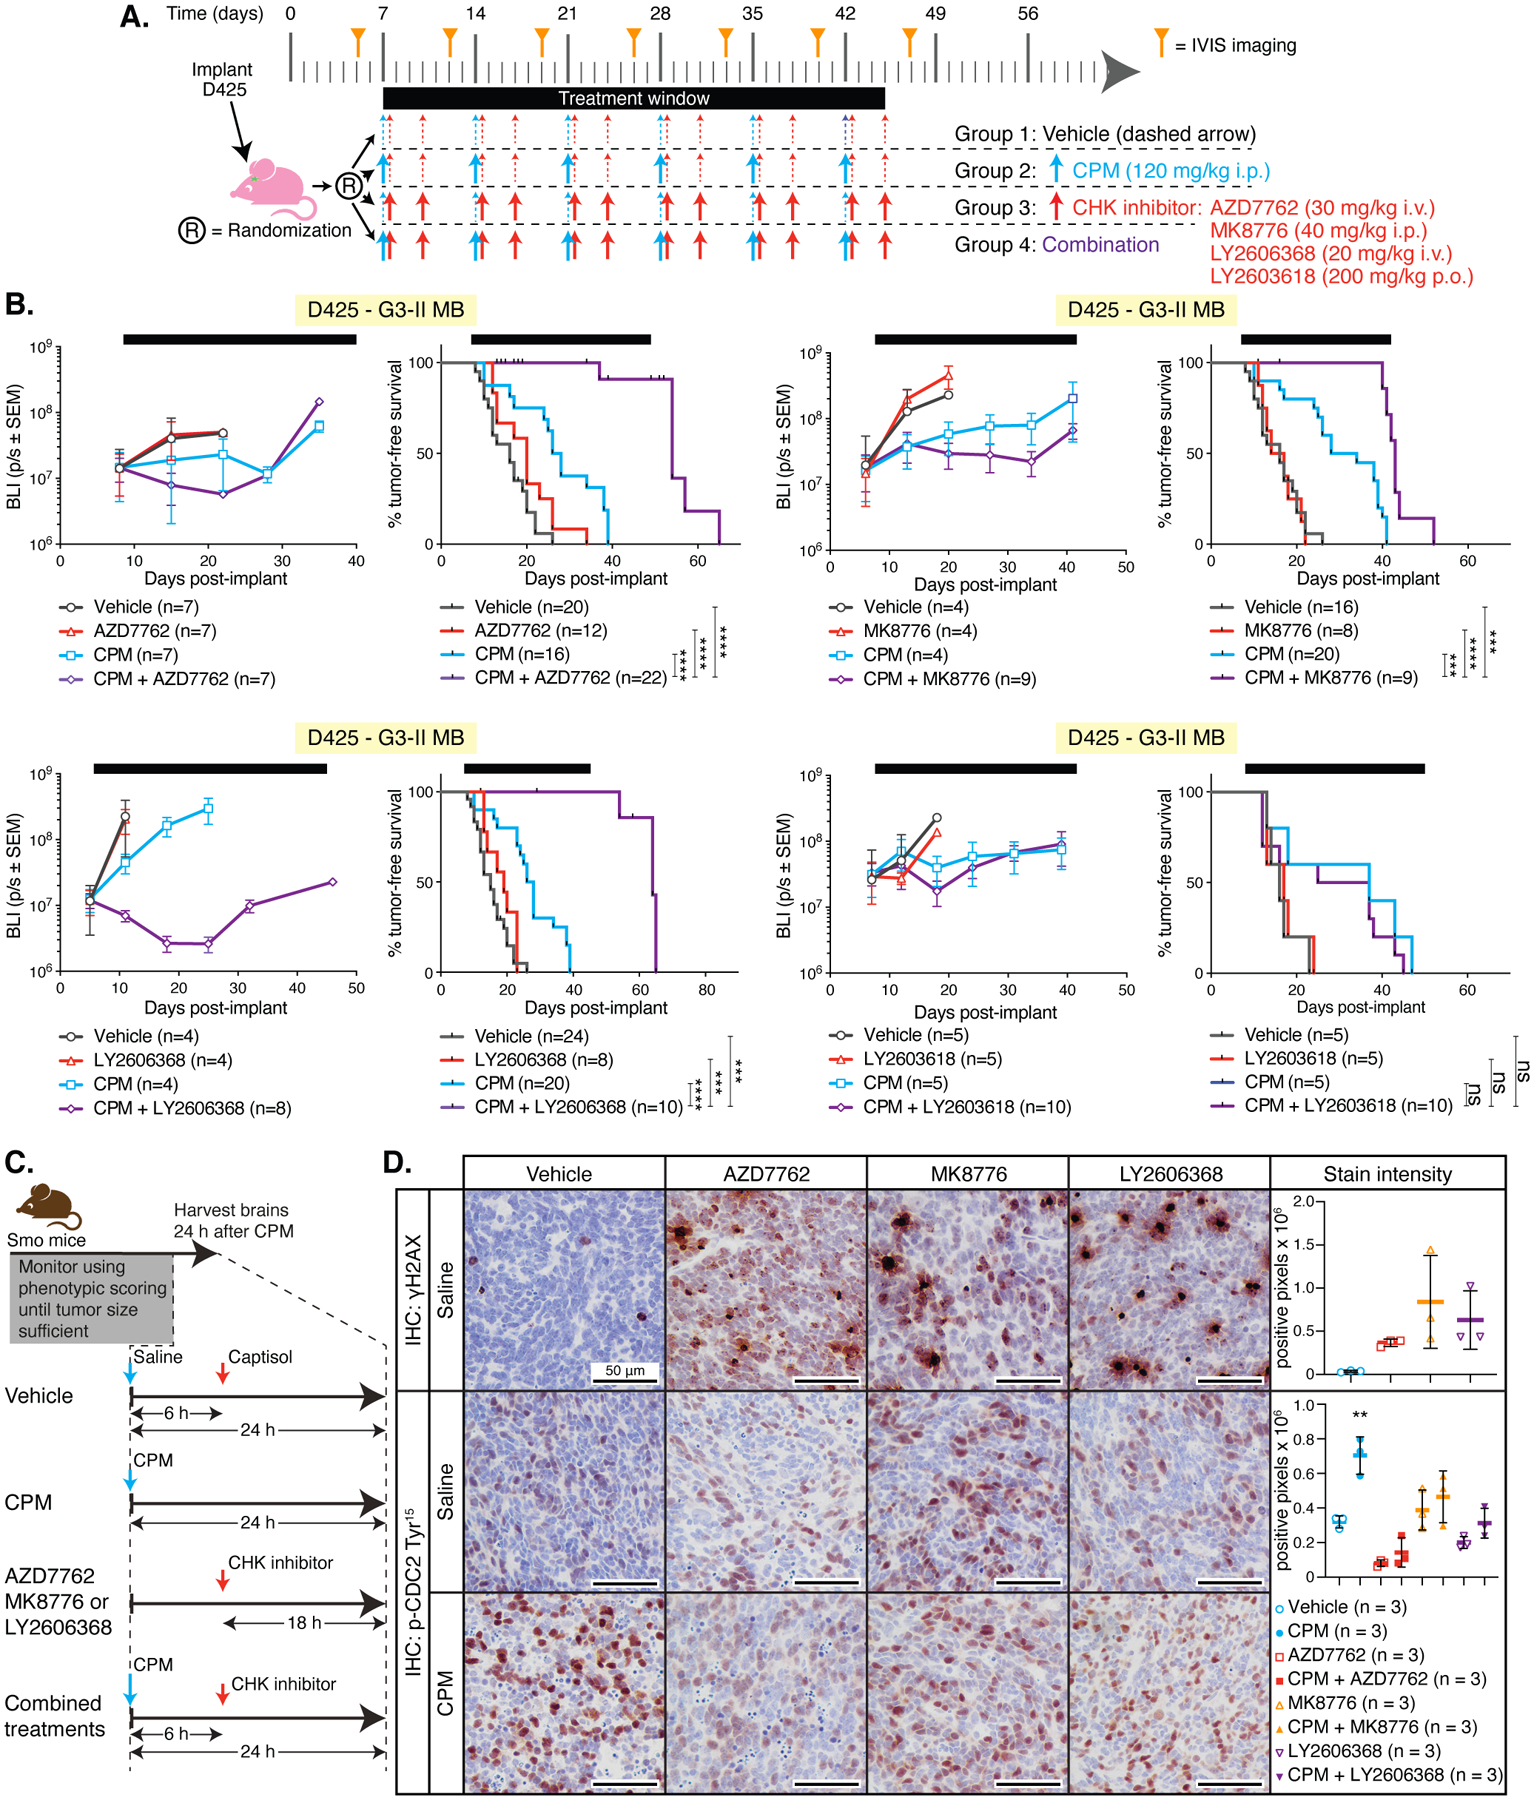
Figure 3. CHK inhibitors have significant anti-MB efficacy when combined with CPM.

(A) Preclinical mouse treatment protocol for data shown in B. (B) Mice harboring orthotopic D425 MB xenografts were treated as indicated. Left graphs in each pair show bioluminescence (BLI) measurements from a single representative experiment; right graphs show survival curves pooled from multiple independent experiments (except for the experiment with LY26063618, which was only performed once). Number of mice tested per group (n) and comparisons between the combination-treated groups with each other group using Log-rank tests are shown: P < 0.001, ***; P < 0.0001, ****; not significant, (ns). (C) Schematic representation of drug administration in Smo mice and timing of tissue harvest for data shown in D. (D) Representative images of immunohistochemistry (IHC) for γH2AX or phosphorylated (p) CDC2 Tyr15 in MB tissue from Smo mice treated with vehicle, AZD7762, MK8776 or LY606268 with saline or with CPM. Mean staining intensity was determined using Image J software using 3 fields of view from 3 individual mice. Significant differences in γH2AX and p-Cdc2 Tyr15 staining between CPM-treated mice and all other groups was determined by an ordinary one-way ANOVA with Tukey’s multiple comparisons test. P < 0.01, **’; P < 0.001, ***.
