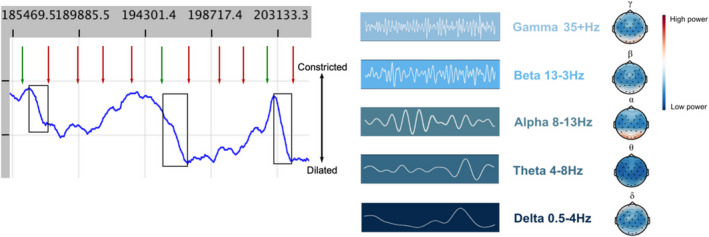
Figure 4.

Examples of biomarker modalities that can be used to assess noradrenergic function in Alzheimer's disease. (A) Snapshot of unpublished pupillometry data from one individual during an oddball task. This task uses infrequent stimuli (oddballs), in a sequence of frequent stimuli to elicit a pupil dilation, that is used as a measure of attention as controlled by the LC‐NE system. Black box highlights pupil dilation in response to oddball (green arrow) rather than standard tone (red arrow). (B) Different frequency bands of EEG signal can be quantified. The highest frequency, gamma waves are thought to be altered in Alzheimer's disease as a result of noradrenergic dysfunction. Topoplots of unpublished healthy control data on the right of the figure show the different relative power across the cortex seen across the five frequency bands.
