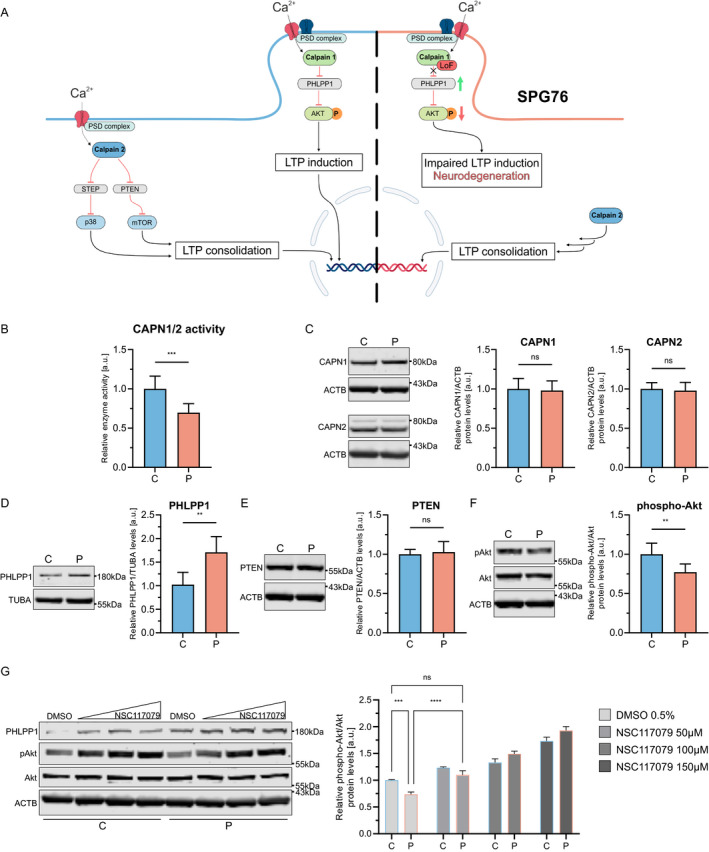
Figure 2.

Calpain‐1 pathway and results of functional studies. (A) Schematic of the calpain‐1 and calpain‐2 pathways. The left half depicts physiological calpain signaling. The right half shows the impact of the loss of calpain‐1 function and associated dysregulation of downstream signaling in SPG76. (B) Calpain‐1 and calpain‐2 activity are measured in fibroblast lysates using a fluorogenic assay (p = 0.0004). (C) Western blot for calpain‐1 and calpain‐2 (p = 0.67, p = 0.93). (D) Western blot for calpain‐1 substrate PHLPP1 (p = 0.0087). (E) WB for calpain‐2 substrate PTEN (p > 0.99). (F) Western blot for Akt and phospho‐(Ser473)‐Akt (p = 0.004). (G) Western blot of NSC117079‐ or DMSO‐treated fibroblasts for Akt and phospho‐Akt. Whole‐cell fibroblast lysates were used for all WB experiments. Molecular weights are provided in kilodaltons (kDa). C, control; CAPN1, calpain‐1; CAPN2, calpain‐2; P, proband. Values are shown as mean ± SD, (ns = not significant, **p < 0.01, ***p < 0.001, ****p < 0.0001; [B–F] Mann–Whitney U test; [G] two‐way ANOVA with multiple comparisons and Tukey's post hoc analysis). [Colour figure can be viewed at wileyonlinelibrary.com]
