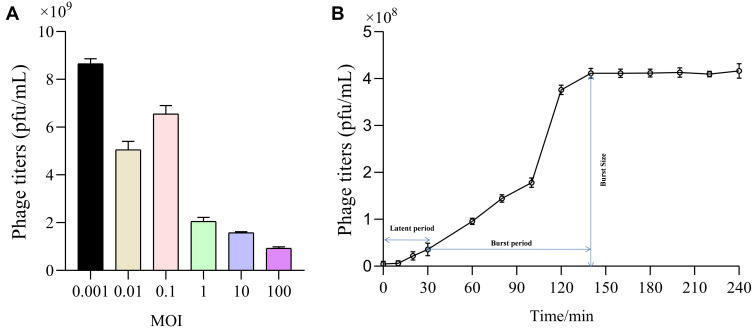
Figure 2.
Biological characterization of bacteriophage IME268. The optimal MOI (A) and one-step growth curve of phage IME268 (B); Results are presented as mean values ± SD. Strains at the optimal MOI. The supernatants were harvested at 10 min intervals post-infection, and titers were determined using the double-layer method.

