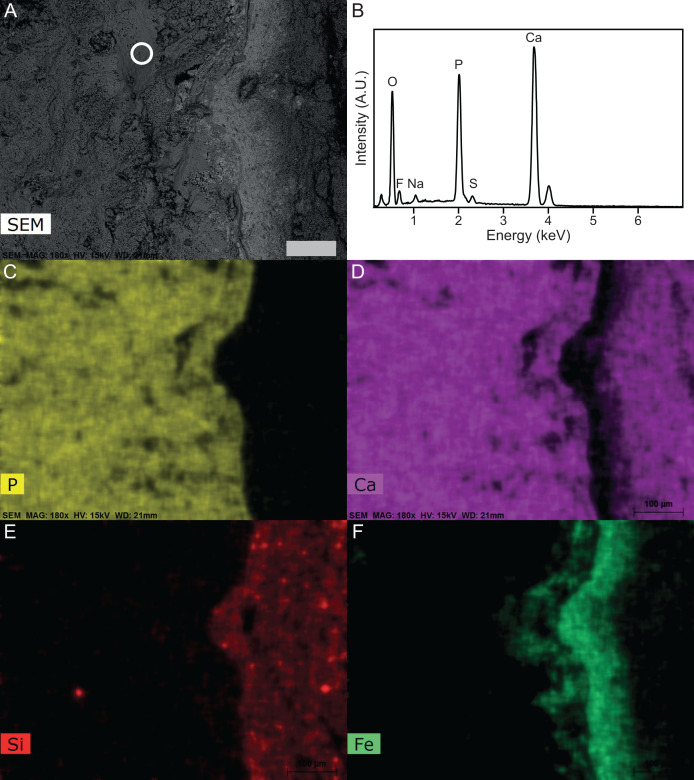
Figure 8. SEM-EDS of Late Jurassic Aegirosaurus sp. (sample JME-SOS-08369-B2) from Eichstätt-Blumenberg, Germany.
(A) SEM back-scatter image where the circle shows the area from which the EDS analysis of (B) is taken. (C)–(F) are element maps corresponding to (A), showing the sharp boundary between the fossil (rich in P in the form of apatite) and the surrounding matrix free of apatite. Scale bar is 100 µm for all images.

