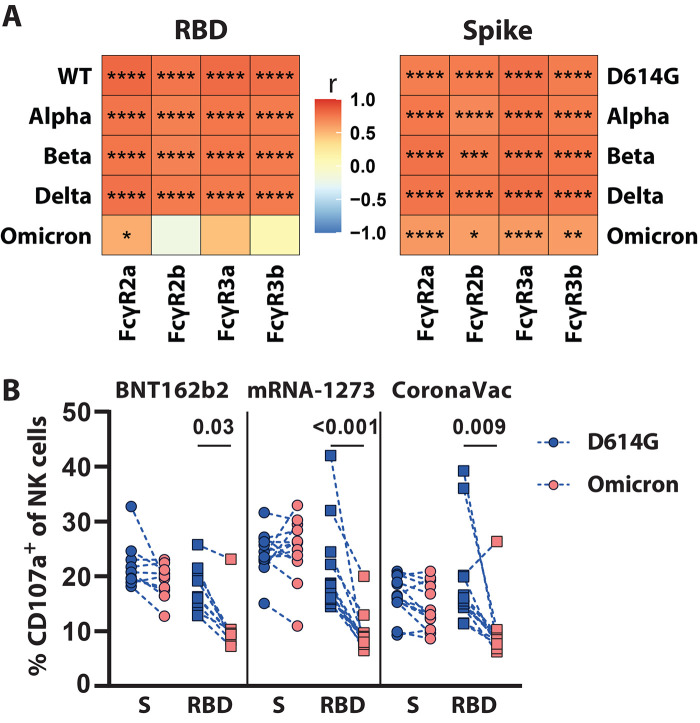
Fig. 3. Vaccine induced binding titers correlate with FcγR binding across VOCs.
The heatmaps show the Spearman correlation between the D614G or VOC (A) RBD-specific or (B) Spike protein-specific IgG1 titers and antibody binding to the respective FcγRs. The color indicates the correlation coefficient (r) as indicated by the color key. Asterisks indicate statistically significant correlations; *p≤0.05, **p≤0.01, ***p≤0.001, ****p≤0.0001.

