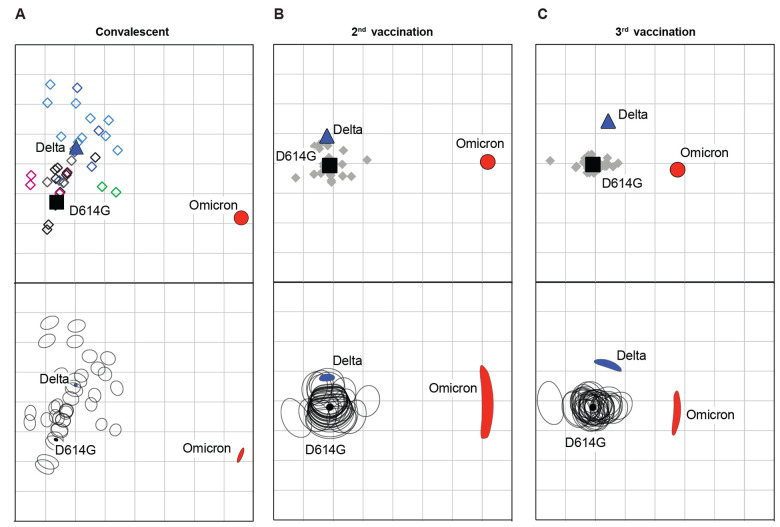
Fig. 3. Antigenic cartography of convalescent and vaccinee serum samples against D614G, Delta, and Omicron variants.
Antigenic maps were generated from (A) convalescent, (B) 2nd vaccination, or (C) 3rd vaccination serum samples. Convalescent serum samples are shown in open diamonds as follows: B.1 (black), B.1.2 (gray), B.1.1.7 (magenta), B.1.351 (green), AY variants (light blue), and B.1.617.2 (dark blue). Solid gray diamonds correspond to post-vaccination serum. Each grid square (1 antigenic unit) corresponds to a 2-fold dilution in the neutralization assay. Antigenic distance is interpretable in any direction. Black squares correspond to D614G variant. Blue triangles correspond to the Delta variant. Red circles correspond to the Omicron variant. The confidence area of the position of individual viruses or serum sample displayed in the bottom panels was estimated with stress parameter 0.5 and is shown as a rounded shape in the maps.

