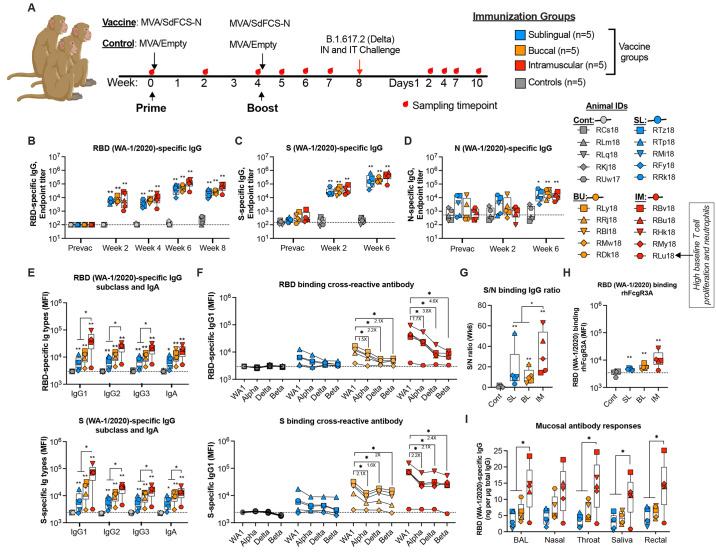
Fig. 3. Systemic and mucosal antibody responses elicited following MVA/SdFCS-N immunization in rhesus macaques.
(A) Schematic of immunizations and SARS-CoV-2 challenges in rhesus macaques. Twenty rhesus macaques were divided into four groups (n = 5 per group).10^8 PFU of MVA/SdFCS-N vaccine was administered via sublingual (SL, aqua blue), buccal (BU, orange) and intramuscular (IM, red) routes and 10^8 PFU of MVA/Empty was delivered via the intramuscular route (Controls, black) at weeks 0 (prime) and 4 (boost). The animals were challenged with SARS-CoV-2 delta (B.1.617.2) virus via intranasal and intratracheal (IT) routes at week 8. The sample collection and necropsy timepoints are indicated by red droplets. Sera collected at pre-vaccination (week 0) and post-vaccination (week 2, 4, 6 and 8) timepoints was used to assess for SARS-CoV-2 WA-1/2020 RBD (B), S (C), and N (D)-specific antibodies longitudinally. Post-boost (week 6) serum was used to assess WA-1/2020 (RBD (upper), and S (lower))-specific immunoglobulin (Ig) isotypes (E), and RBD (upper) and S (lower)-specific alpha, delta, and beta- cross-binding IgG1 antibody titers (F), respectively. (G) Ratio of S binding IgG to N binding IgG. (H) RBD (WA-1/2020) binding FcγR3A. (I) Post-vaccination (week 6), RBD (WA-1/2020)-specific IgG antibody was assessed in bronchoalveolar lavage (BAL) fluid, and nasal, throat, salivary, and rectal secretions. Data represent one independent experiment. Each sample was analyzed in duplicate. Individual data points reflected by unique shapes in Fig. 3B to 3I represent individual NHP. Whisker plots show the maximum and minimum values. Dotted lines indicate binding assay limits of detection. Data are mean ± SEM. A two-sided Mann–Whitney U-test was used to compare between groups, *p < 0.05 and **p < 0.01.

