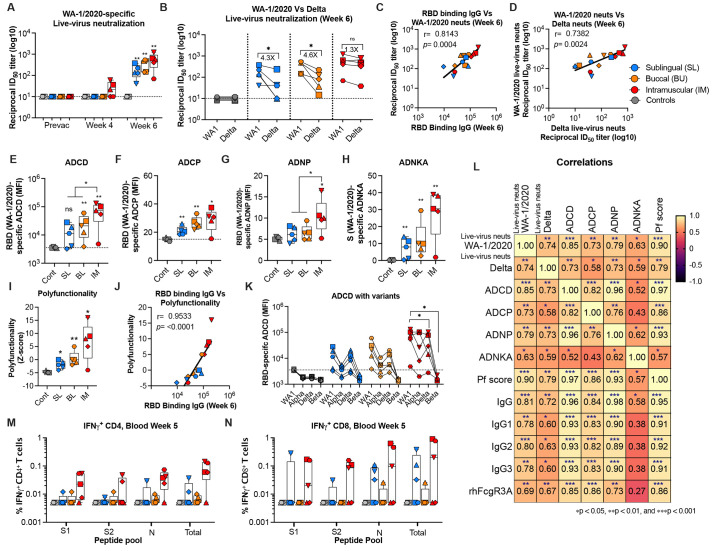
Fig. 4. Functional antibody responses elicited following MVA/SdFCS-N immunization in rhesus macaques.
(A) Sera collected at pre- (week 0) and post- (week 4 and 6) vaccination timepoints were used to assess live-virus WA-1/2020-specific neutralization activity. (B) Cross-reactive delta variant-specific cross-neutralization activity (week 6 only). Each sample was analyzed in duplicate. (C-D) Correlation analysis between RBD (WA-1/2020) binding titers and live-virus neutralization of WA-1/2020 (C), and between live-virus neutralization titers of SARS-CoV-2 WA-1/2020 and delta live-viruses (D). RBD (WA-1/2020)-specific antibody-dependent effector functions (2-weeks post-boost): ADCD (E), ADCP (F), ADNP (G), S (WA-1/2020)-specific ADNKA (H), Polyfunctionality score (Z-scores)(I). (J) Correlation analysis between RBD (WA-1/2020) binding titers and polyfunctionality. The Spearman rank test was used to perform correlation analysis. (K) Cross-binding ADCD functions (2-weeks post-boost) against RBD of variants. (L) Correlation matrix analysis between antibody-dependent functions (neutralization, ADCD, ADCP, ADNP, ADNKA, and polyfunctionality score) and RBD (WA-1/2020)-specific antibody isotypes, and FcγR3A binding in serum at 6 weeks (2 weeks post-boost). The color refers to r value scale (−1 to 1) shown on the right. The number in each cell indicates the actual r value and the stars represent p-values. (M-N) S1, S2 and N-specific CD4+ (M) and CD8+ (N) T cells in blood at week 5 (week 1 post-boost) after re-stimulation with a peptide pool. S1, S1 region of spike residues 1-685; S2, S2 region of spike residues 686-1273; N, nucleocapsid; Sum, total response (S1 + S2 + N). Data represent one independent experiment. Whisker plots show the maximum and minimum values. Dotted lines indicate functional assay limits of detection. Data are mean ± SEM. A two-sided Mann–Whitney U-test was used to compare between groups, *p < 0.05, **p < 0.01, and ***p < 0.001.

