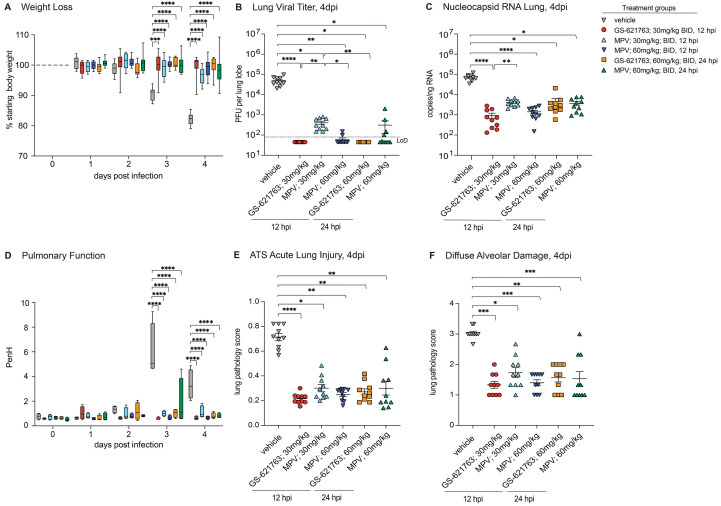
Fig. 4. Evaluation of therapeutic intervention of GS-621763 in comparison to MPV.
(A) Depicted is the percent starting weight in in mice treated therapeutically with either 30 mg/kg or 60 mg/kg GS-621763 or MPV at 12 or 24 hpi (n=10 for all treatment groups). All mice were infected with 1x10⁴ PFU SARS-CoV-2 MA10. (B) Lung viral titers were measured in mice that were therapeutically treated with either 30 mg/kg or 60 mg/kg GS-621763 or MPV at 12 or 24 hpi (n=10 for all treatment groups). All mice were infected with 1x10⁴ PFU SARS-CoV-2 MA10. The dashed line indicates the limit of detection (LoD). (C) Viral Nucleocapsid RNA was measured in mice therapeutically treated with either 30 mg/kg or 60 mg/kg GS-621763 or MPV at 12 or 24 hpi (n=10 for all treatment groups). All mice were infected with 1x10⁴ PFU SARS-CoV-2 MA10. (D) Pulmonary function was measured in mice therapeutically treated with either 30 mg/kg or 60 mg/kg GS-621763 or MPV at 12 or 24 hpi (n=4 for all treatment groups). All mice were infected with 1x10⁴ PFU SARS-CoV-2 MA10. PenH is a surrogate measure for bronchoconstriction. (E and F) Lung pathology was quantified in mice therapeutically treated with either 30 mg/kg or 60 mg/kg GS-621763 or MPV at 12 or 24 hours (n=10 for all treatment groups). All mice were infected with 1x10⁴ PFU SARS-CoV-2 MA10. ATS acute lung injury (E) and diffuse alveolar damage (F) were scored in a blinded manner. Data were analyzed using two-way ANOVA (weight loss and lung function) and Kruskal-Wallis test (lung titer, lung viral RNA, and pathology scores), *p<0.05, **p<0.005, ***p<0.0005, ****p<0.0001. Box and whisker plots in (A) and (D) show Minimum (Min) to Maximum (Max) values. Data in (B), (C), (E), and (F) are shown as mean ± SEM.

