FIGURE 3.

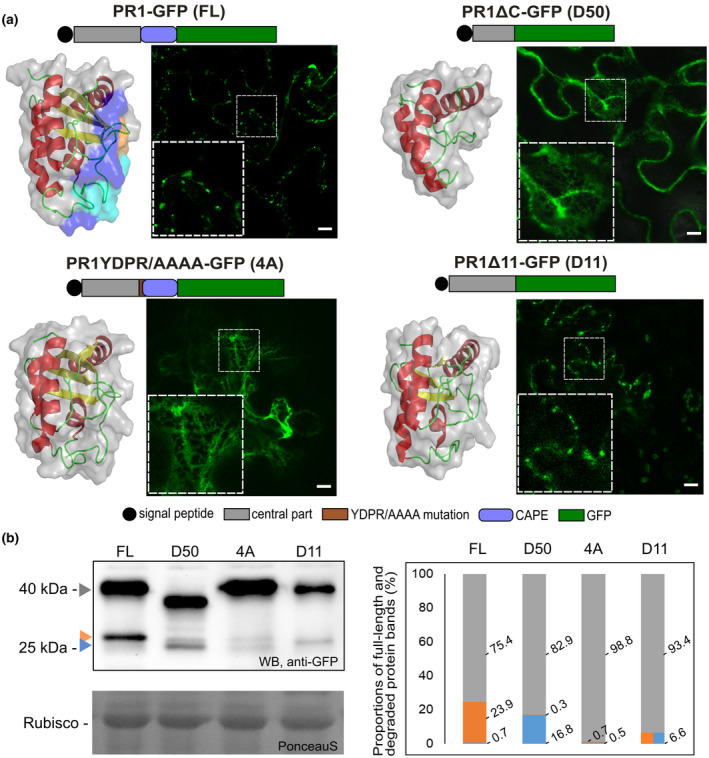
Localization and expression patterns of PR1 and its truncated and mutated variants tagged with green fluorescent protein (GFP). (a) Schematic representation and intracellular localizations in transiently transformed Nicotiana benthamiana leaves and three‐dimensional models are presented for each of the construct variants. In full‐length wild‐type (FL) models, orange shows a region differing from mutated 4A, cyan a missing part in D11, and light blue a missing part in D50. Confocal images show either vesicular type of localization (FL and D11) or endoplasmic reticulum (ER)‐retained (D50 and 4A) localization of PR1 variants. FL, full‐length PR1‐GFP; D50, PR1ΔC‐GFP; 4A, PR1YDPR/AAAA‐GFP; D11, PR1Δ11‐GFP. Insets depict a magnified view of the signal in the dashed squares. Bars = 10 μm. (b) Western blot analysis of PR1 variant expression using anti‐GFP antibody. The whole fusion protein bands (c.40 kDa) are indicated with a grey arrowhead. Lower bands are indicative of proteolysis, the blue arrowhead points to the smaller band corresponding to c.27 kDa free GFP, and the orange arrowhead points to the slightly bigger band with additional amino acids from PR1 C‐terminus, c.29 kDa. On the right: graph of the intensity distributions for two whole fusion constructs (grey bars) and cleaved bands (orange bars and blue bars for 29 and 27 kDa bands, respectively) for each of the variants. In the case of D11, the proteolysis gave only one GFP band of weight between 29 and 27 kDa, indicative of alternative proteolysis (orange–blue bar). The quantification shows enhanced proteolysis resulting in the strongest upper 29 kDa band in FL, especially in comparison to the D50 variant with the most prominent unspecific 27 kDa GFP band. The 4A construct was the least proteolysed
