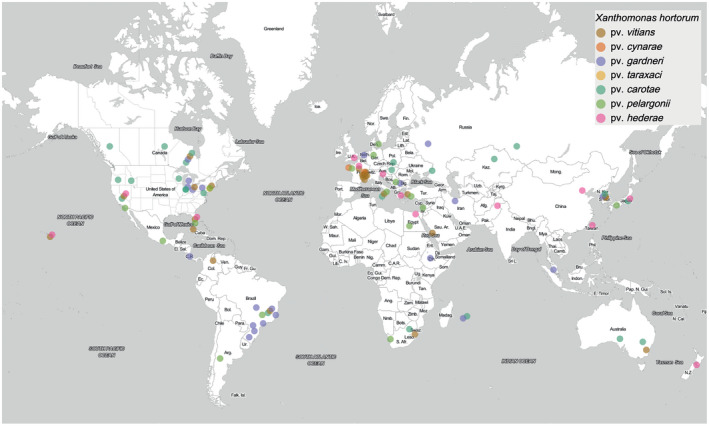
FIGURE 4.

Distribution of the seven Xanthomonas hortorum pathovars. Map from the ggmap R package (Kahle et al., 2019) and data adapted from the European and Mediterranean Plant Protection Organization (EPPO). Location is an approximation based on literature available
