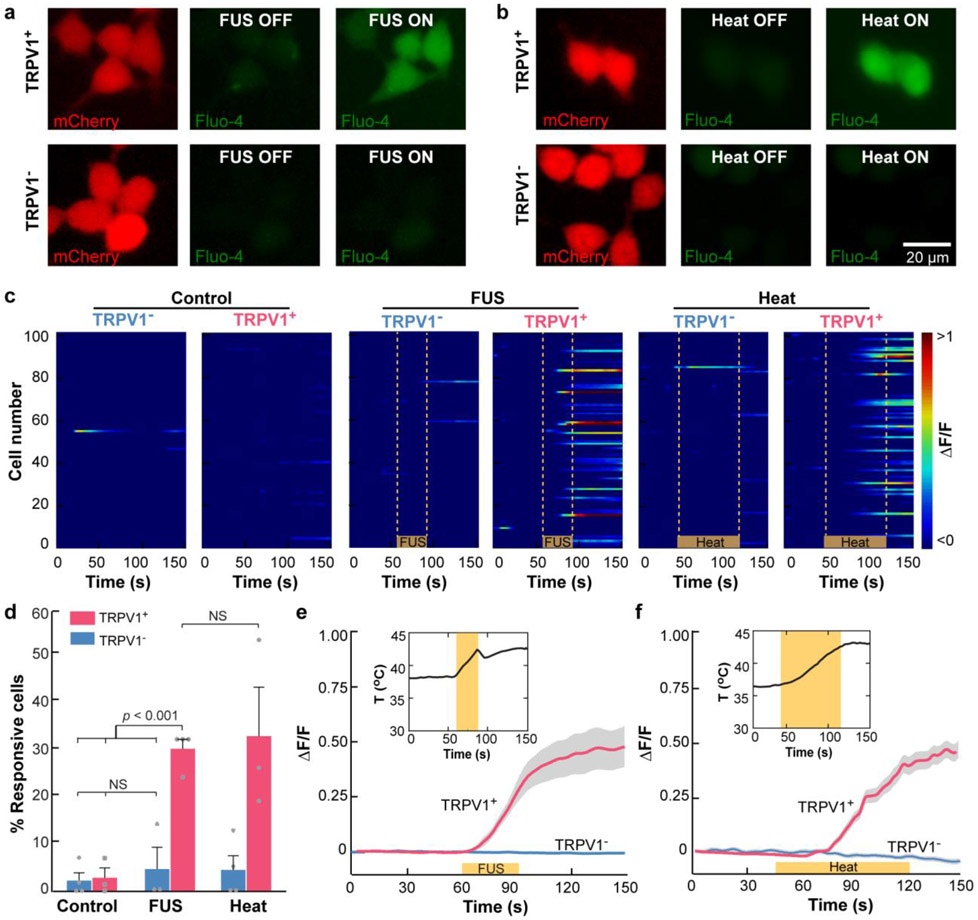
Fig. 1. TRPV1 enables FUS activation of HEK293T cells in vitro.
(a, b) Fluorescence images of HEK293T cells. Red: HEK293T cells expressing mCherry with the TRPV1 ion channel (TRPV1+, top row) or without the TRPV1 ion channel (TRPV1−, bottom row). Green: Intracellular Ca2+ before and after (a) FUS stimulation and (b) water-bath heating. (c) Heatmap of the normalized Ca2+ fluorescence intensity change (ΔF/F) of 100 randomly selected TRPV1+ and TRPV1− cells from 3–4 independent trials in the control group without any stimulation (left panel), the FUS group (middle panel), and the heating group (right panel). The yellow lines indicate FUS on in the FUS group and heat on in the water-bath heating group. (d) Percentage of TRPV1+ and TRPV1− cells within the FOV of the fluorescence microscope that responded to FUS stimulation and water-bath heating, respectively. Cells in the control group were not stimulated. The error bar indicates the standard error of the mean (SEM). Normalized fluorescence intensity change (ΔF/F) of TRPV1+ and TRPV1− induced by (e) FUS stimulation and (f) water bath heating. The solid lines indicate the mean, and shaded gray represents SEM. The insert shows the corresponding temperature curve.

