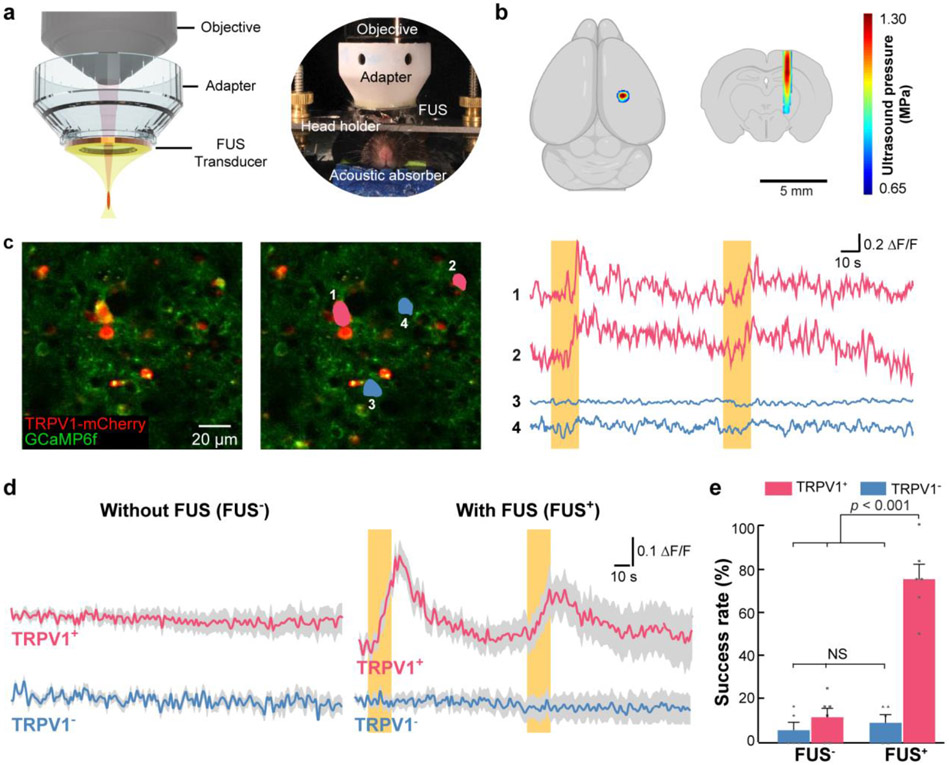
Fig. 2. Sonothermogenetics selectively activates TRPV1+ neurons in vivo.
(a) Schematic illustration (left) and a photo (right) of the 2PM setup that couples a ring-shaped FUS transducer with the microscope objective using a customized adapter. The mouse head was fixed by a holder to minimize motion artifacts in 2PM imaging. An acoustic absorber was placed underneath the mouse head to decrease the reflection of the ultrasound pulses from the bottom of the mouse head. (b) The FUS pressure distribution maps in the transverse and coronal planes are superimposed on drawings of the mouse brain. (c) A representative 2PM image of the mouse cortex in vivo is shown on the left. The image on the right highlights two neurons (1 and 2 in pink) expressing both TRPV1-mCherry and GCaMP6f and two neurons (3 and 4 in blue) expressing only GCaMP6f without TRPV1. The Ca2+ fluorescence intensity changes over time of the 4 neurons are shown next to the 2PM image. (d) Average Ca2+ fluorescence intensity curves for mice with and without TRPV1 overexpression with FUS stimulation (FUS+) and without FUS stimulation (FUS−) (n = 17 neurons from 6 TRPV1+ mice and n = 16 neurons from 5 TRPV1− mice). Solid lines and the shaded area indicate the mean and the SEM. Yellow bars indicate FUS on. (e) Comparison of the averaged success rate of these selected neurons with and without FUS stimulation. The error bar represents the SEM.

