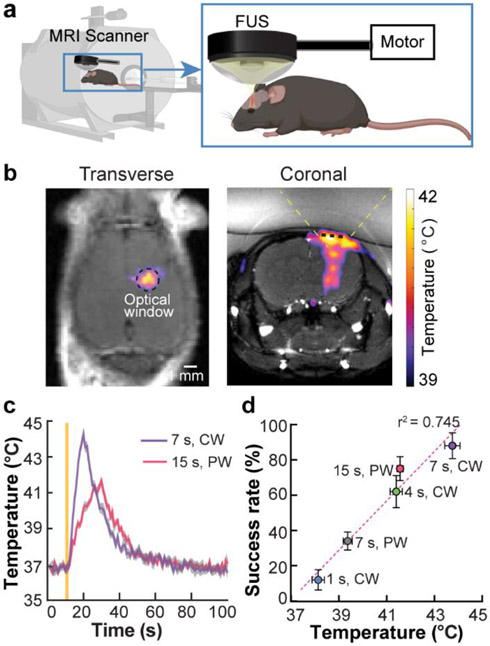
Fig. 4. Control of sonothermogenetics by FUS-induced local heating.
(a) Integration of FUS with MR for imaging FUS-induced temperature rise in the mouse brain by in vivo real-time MR thermometry. (b) Spatial distribution of FUS-induced heating in the transverse and coronal views as imaged by MR thermometry. The location of the optical window for 2PM is indicated by the black dashed circle in the transverse plane and by the black dashed line in the coronal plane. The yellow dashed lines in the coronal plane illustrate the FUS beam. (c) Mean temperature within the optical window as a function of time for both PW and CW stimulation. The solid yellow line indicates the onset of FUS sonication. (d) A linear correlation between the peak temperature associated with each FUS parameter and the success rate of TRPV1+ neuron activation (Fig. 2e and 3b) was identified (R2 = 0.745). Error bars indicate SEM.

