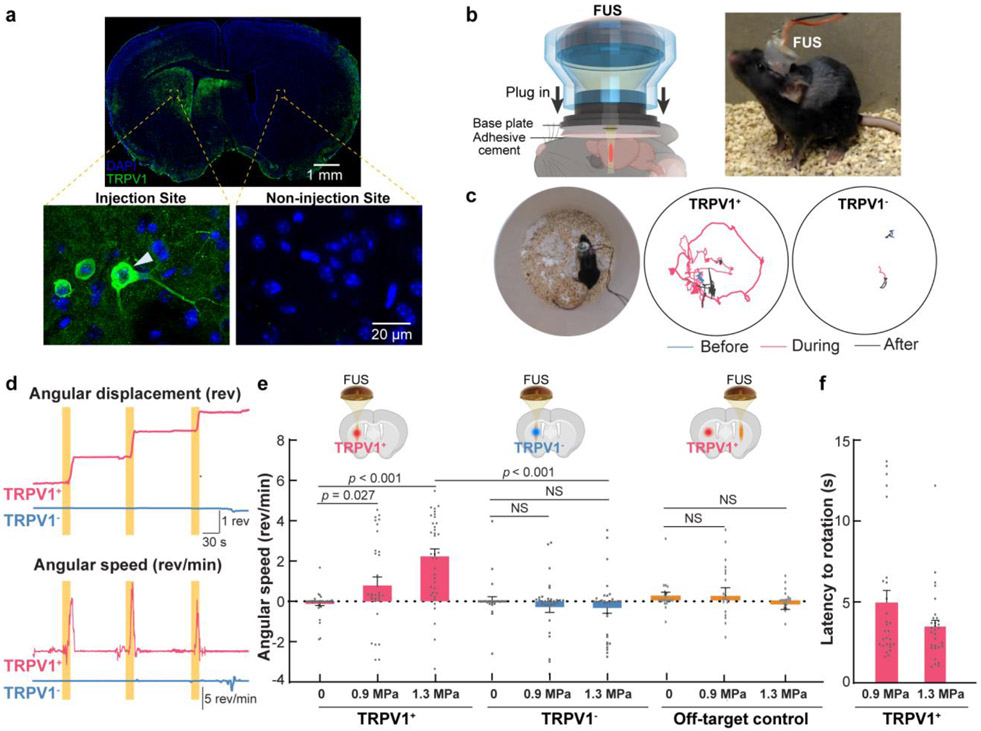
Fig. 5. Sonothermogenetic modulation of mouse locomotor behavior.
(a) Expression of TRPV1 in the mouse brain that was extracted one month after the viral injection and assessed by immunofluorescence staining with an anti-TRPV1 antibody. The arrowhead points at an example of TRPV1-positive neuron. (b) Experimental setup for in vivo sonothermogenetic stimulation of the striatum in freely moving mice. The miniaturized wearable FUS transducer was plugged into a base plate adhered on the mouse head. (c) Representative trajectories recorded in TRPV1+ and TRPV1− mice before (blue), during (red), and after (gray) FUS stimulation (each stimulation was 15-s long and 1.3 MPa). (d) The angular displacement (top) and angular speed (bottom) of the TRPV1+ and TRPV1− mice shown in (c). (Yellow bars indicate the three repeated FUS stimulations. (e) Comparison of the mean angular speed of TRPV1+ mice, TRPV1− mice and off-target control mice with FUS stimulation at different acoustic pressure = 0, 0.9, and 1.3 MPa. TRPV1 expression and FUS sonication location for different groups are illustrated in the upper insert. The positive and negative values indicate rotation in the contralateral and ipsilateral directions, respectively. (f) The behavior onset latency of TRPV1+ mice in response to FUS stimulation. Error bars represent the standard error of the mean.

