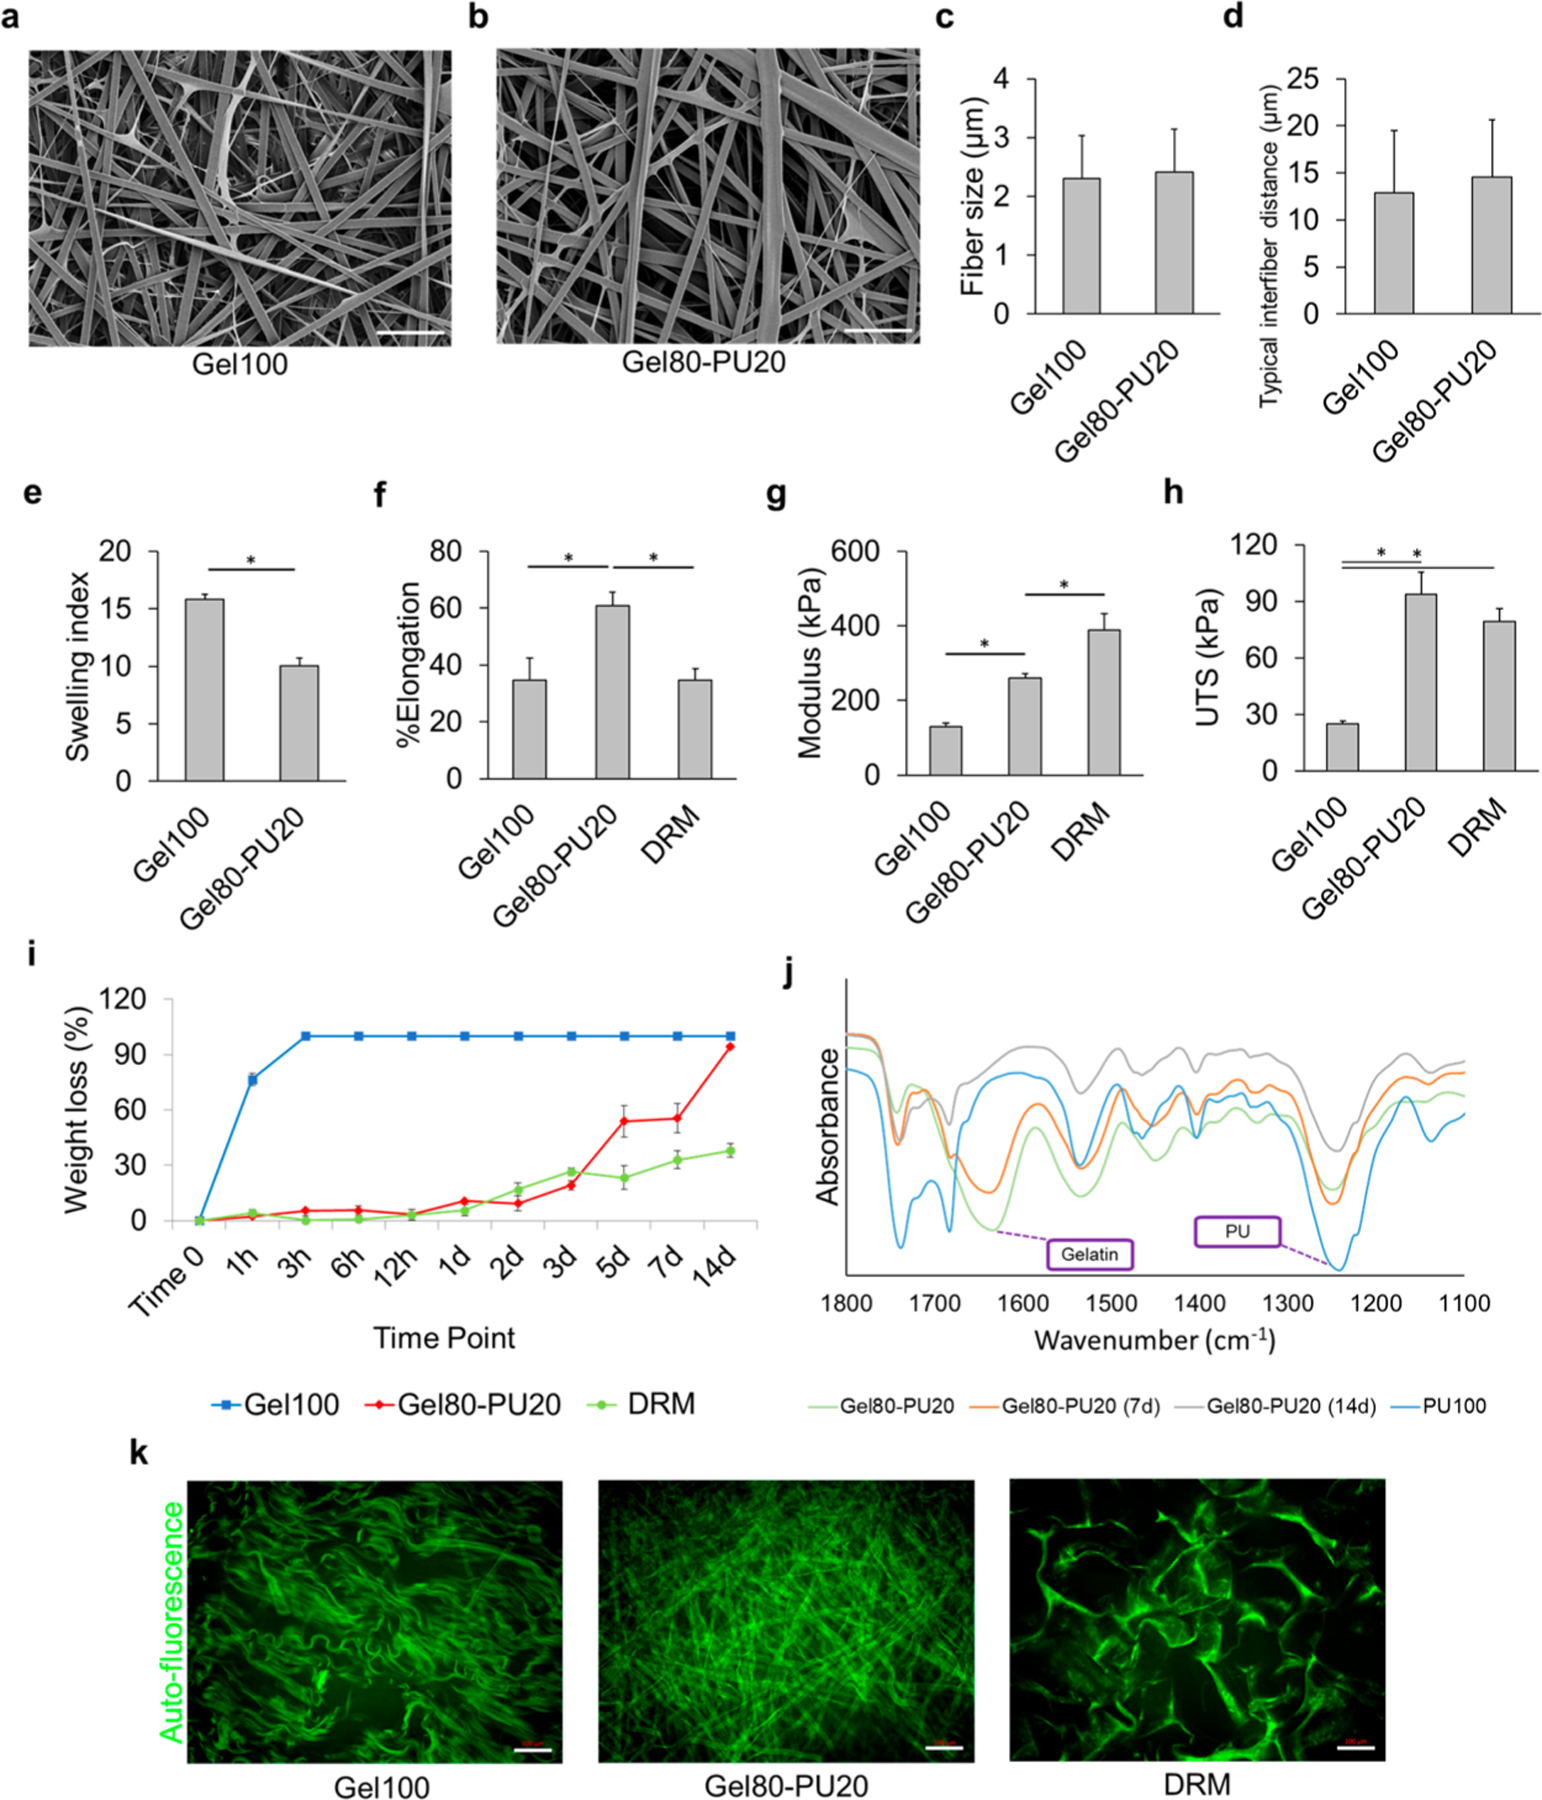
Figure 1.

SEM images of (a) Gel100 and (b) Gel80–PU20. The scale bar is 20 μm. (c,d) Average fiber size and typical interfiber distance of electrospun scaffolds, respectively. (e) Swelling index (ratio of mass change before and after incubation in media to the initial weight) for Gel100, Gel80–PU20, and DRM after incubating the scaffolds in DMEM media for 5 days. All groups are significantly different (Student’s t-test, *P < 0.05). (f) Typical stress–strain curve for gelatin, Gel80–PU20, and DRM. (g) Elastic modulus and (h) UTS of the scaffolds. *P < 0.05. (i) Degradation of different scaffolds in 60 μg/mL collagenase in PBS at 37 °C after different time points. (j) FTIR spectra after collagenase degradation assay for Gel80–PU20 (note: PU100 reported here was intact and not degraded and only used as a relative control to identify PU chemical groups). Distinct peaks corresponding to pure PU and gelatin are labeled. (k) Acellular structure of each scaffold (kept in DMEM media for 7 days) revealed by autofluorescence. The scale bar is 100 μm.
