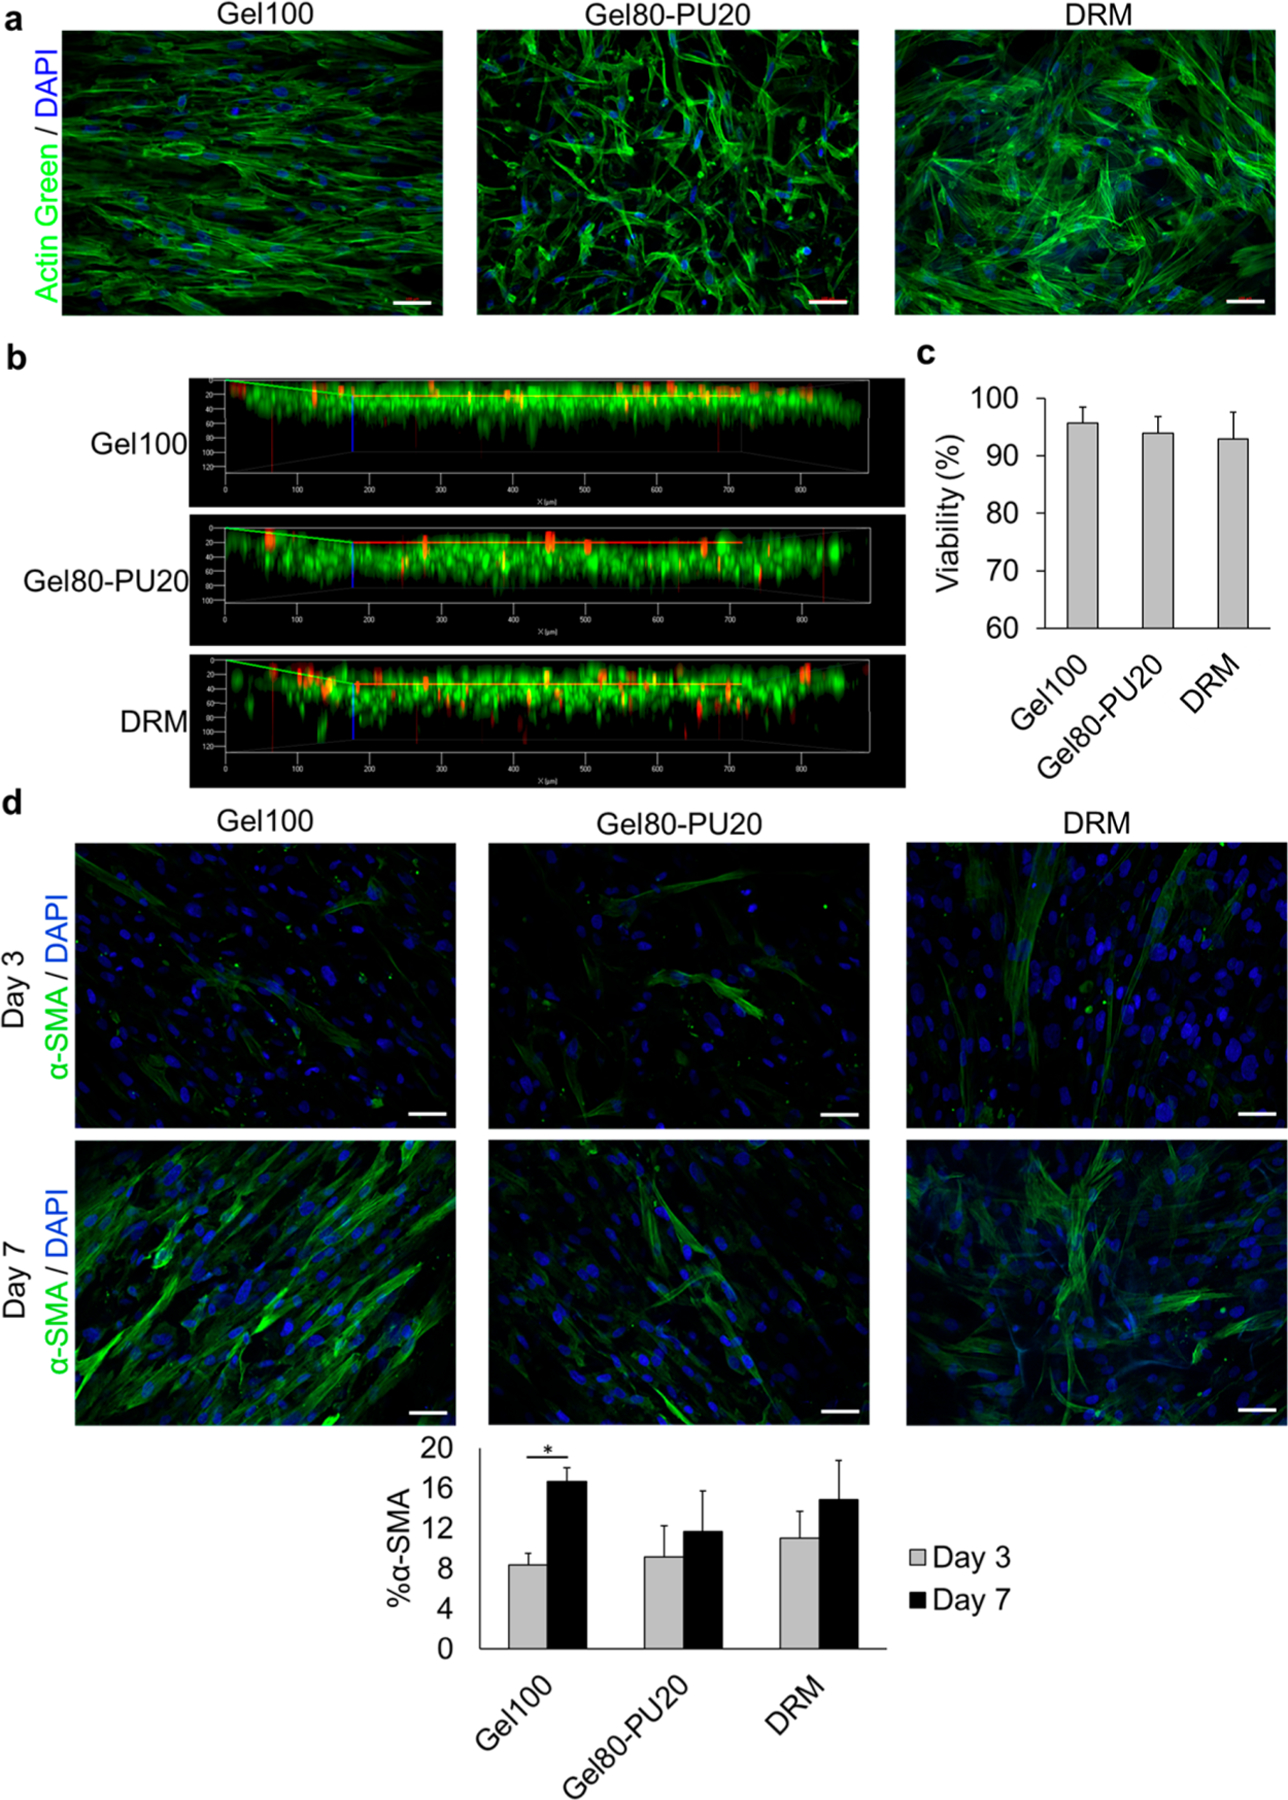
Figure 2.

(a) Cellular interaction with different scaffolds after 7 days: green = F-actin stained with ActinGreen (Alexa Fluor 488) and blue = DAPI in nuclei. (b) Cell penetration level into the scaffolds. (c) Cell viability measurement in each scaffold after Live/Dead staining and counting live and dead cells in the corresponding images. (d) α-SMA expression in HDF cells as a marker of myofibroblasts. Green = α-SMA positive cells and blue = DAPI in nucleus. Graph: quantification of α-SMA stress fiber-positive HDFs. The scale bar in all images is 100 μm.
