Figure 1.
Continued.
Figure 1.
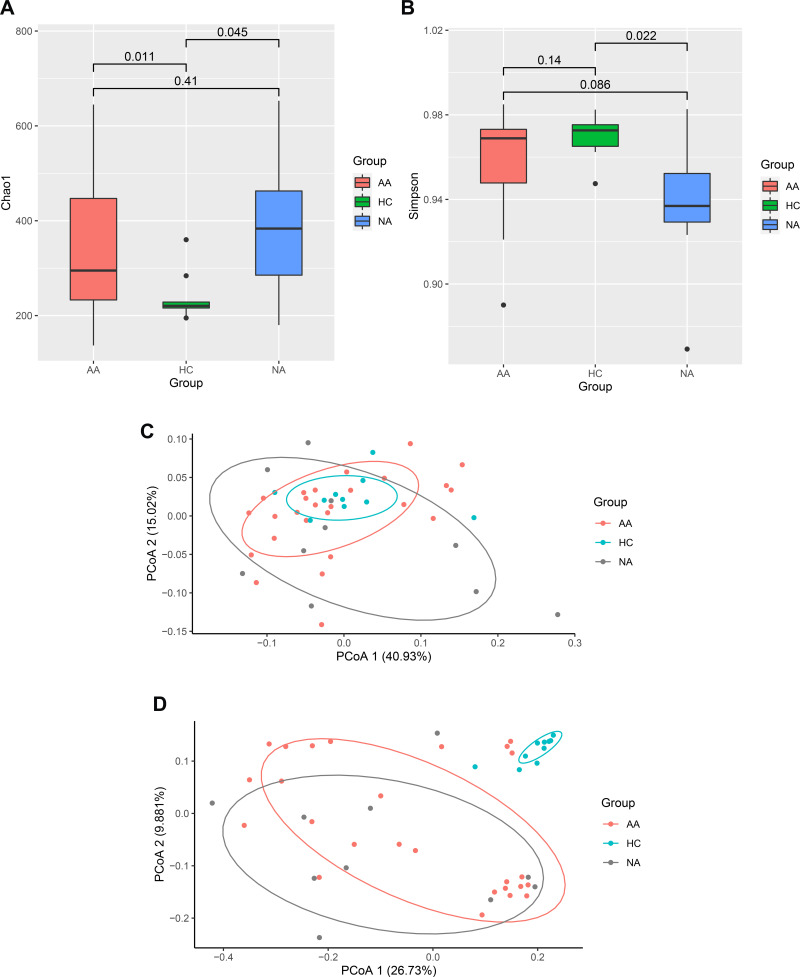
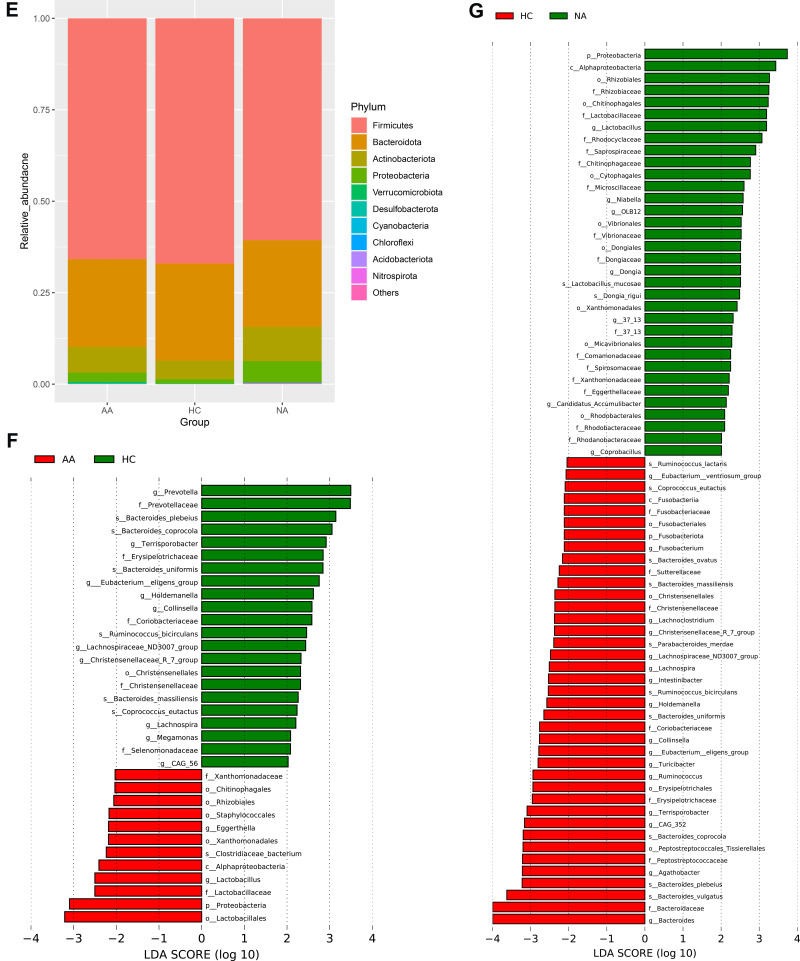
Characters of gut microbiome. (A and B) Alpha diversity (Chao1 and Simpson parameter) in allergic, non-allergic asthma and healthy control groups. (C) PCoA plot based on weighted UniFrac distance, (D) PCoA plot based on unweighted UniFrac distance. (E) Relative abundance of top 10 phyla by groups. The height of bars represents relative abundance. (F) LEfSe analysis between allergic asthma and healthy control groups. (G) LEfSe analysis between non-allergic asthma and healthy control groups. The graph of LEfSe distinguished the microbial communities of each group with LDA > 2 and p < 0.05.
Abbreviations: AA, allergic asthma group; NA, non-allergic asthma group; HC, healthy control group.


