Figure 2.
Continued.
Figure 2.
Continued.
Figure 2.
Continued.
Figure 2.
Continued.
Figure 2.
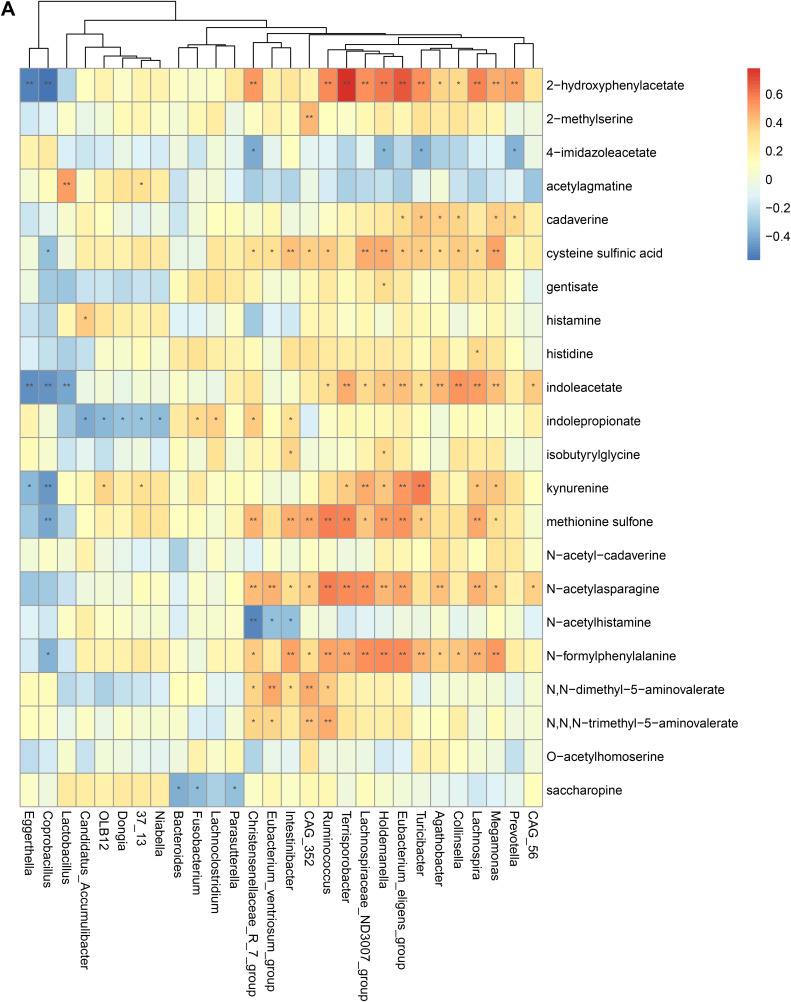
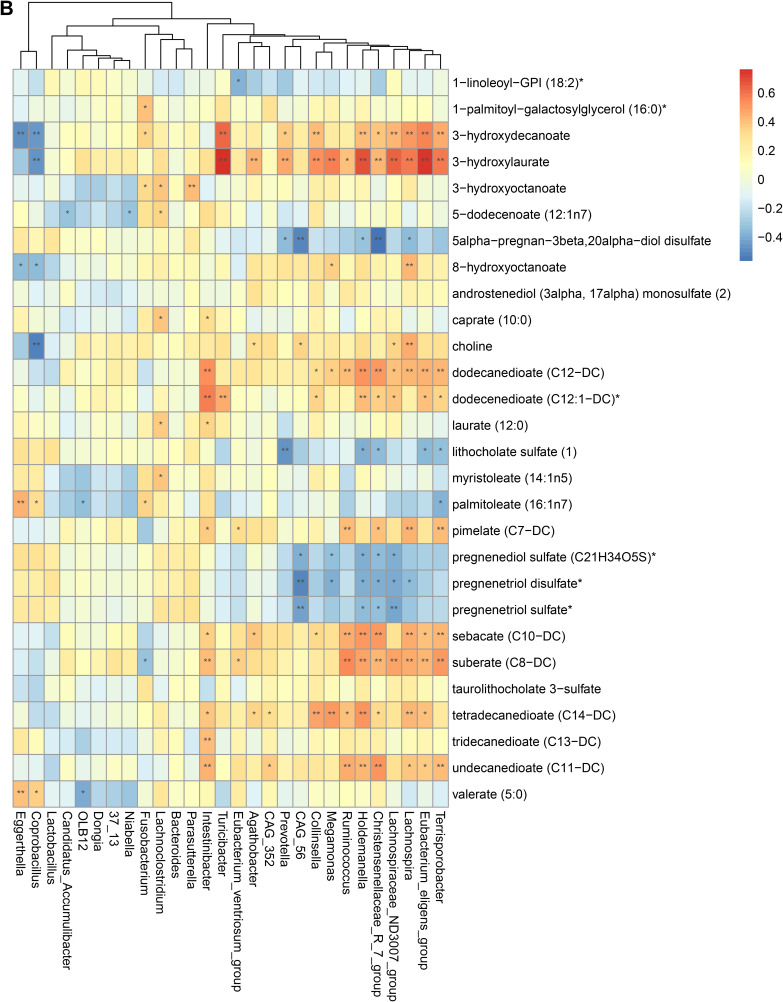
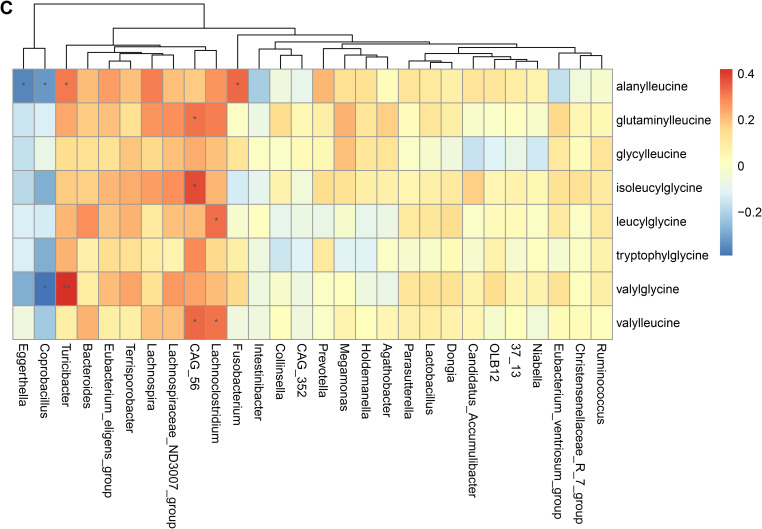
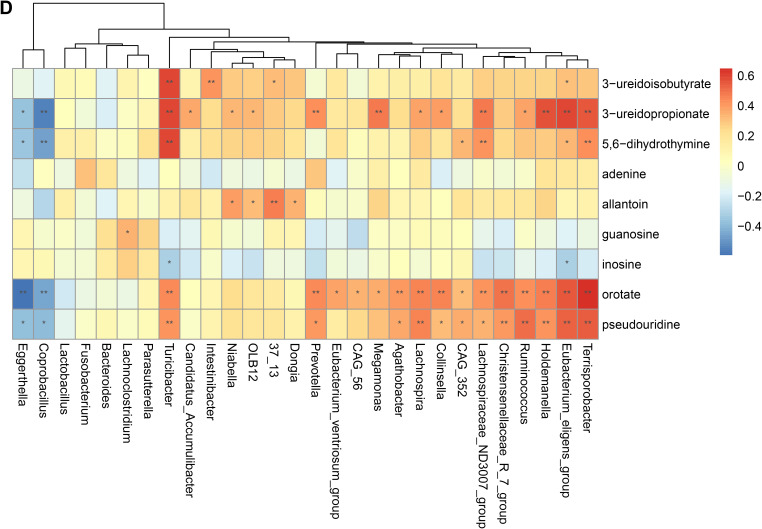
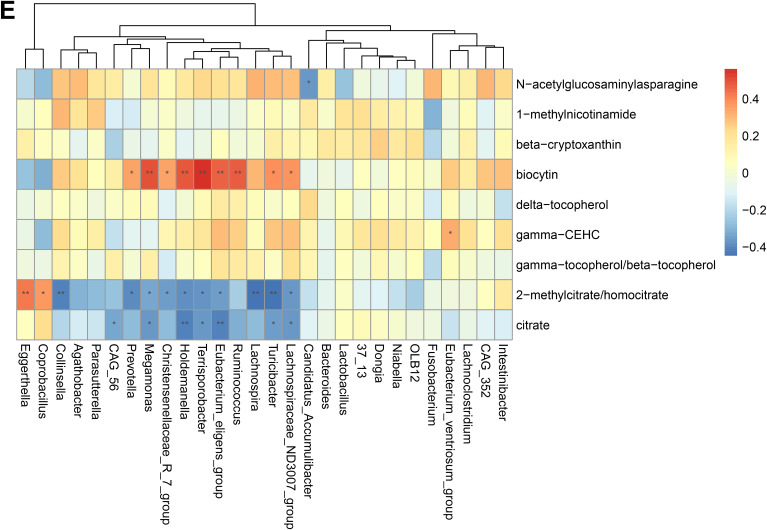
Spearman correlation heatmap for significantly altered metabolites and genera in asthmatics. *p <0.05, **p <0.01. (A) Correlation heatmap for amino acid. (B) Correlation heatmap for Lipid. (C) Correlation heatmap for peptide. (D) Correlation heatmap for nucleotide. (E) Correlation heatmap for others, including carbohydrate, energy, cofactors and vitamins.

