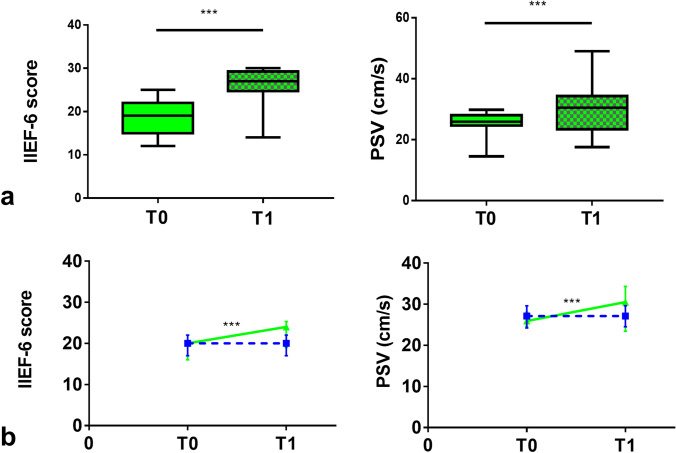
Fig. 2.
a IIEF-6 score and cavernous arteries peak systolic flow velocity (PSV), in l-arginine group, in the overall cohort; values at baseline (T0—solid pattern) and after 90 days (T1—checkered pattern). Values expressed as median with interquartile range (25°–75° centiles) and min to max. b Changes in IIEF-6 score and PSV value over time, from T0 to T1 in l-arginine (continuous green line) compared to placebo (dashed blue line) group, in the overall cohort. Values expressed as median with interquartile range (25°–75° centiles). ***p < 0.0001

