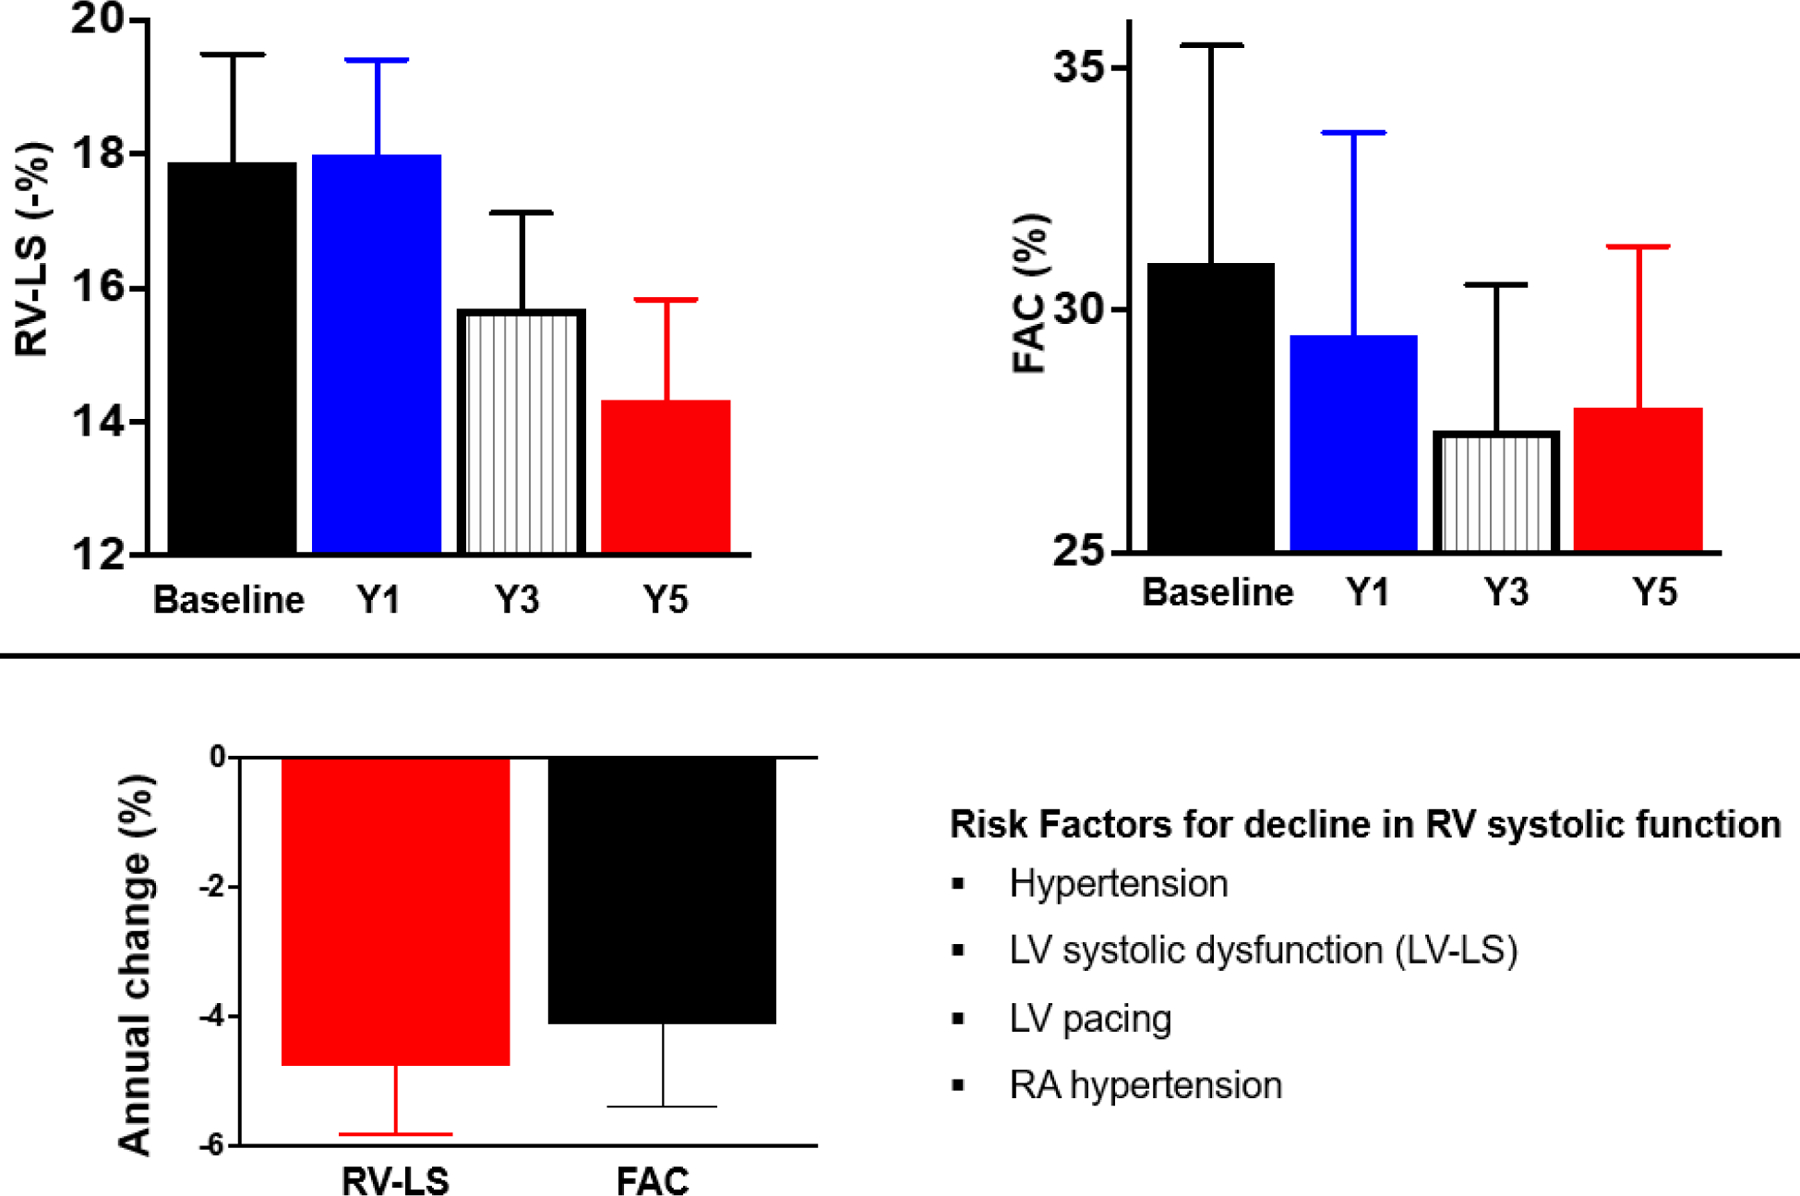
Central illustration: Temporal Changes in RV Systolic Function Indices.

Top: bar graphs showing right ventricular longitudinal strain (RV-LS) and fractional area change (FAC) at baseline, and at 1, 3, and 5-year follow-up. Note that RV-LS is displayed as absolute numbers for ease (i.e. ignoring the negative sign)
Bottom: bar graphs showing the average annual change in RV-LS and FAC. Overall the RV-LS decrease by −4% per year while FAC decrease by −3% per year. The risk factors associated with temporal reduction in RV systolic function were hypertension, left ventricular longitudinal strain (LV-LS), LV pacing and right atrial (RA) hypertension
