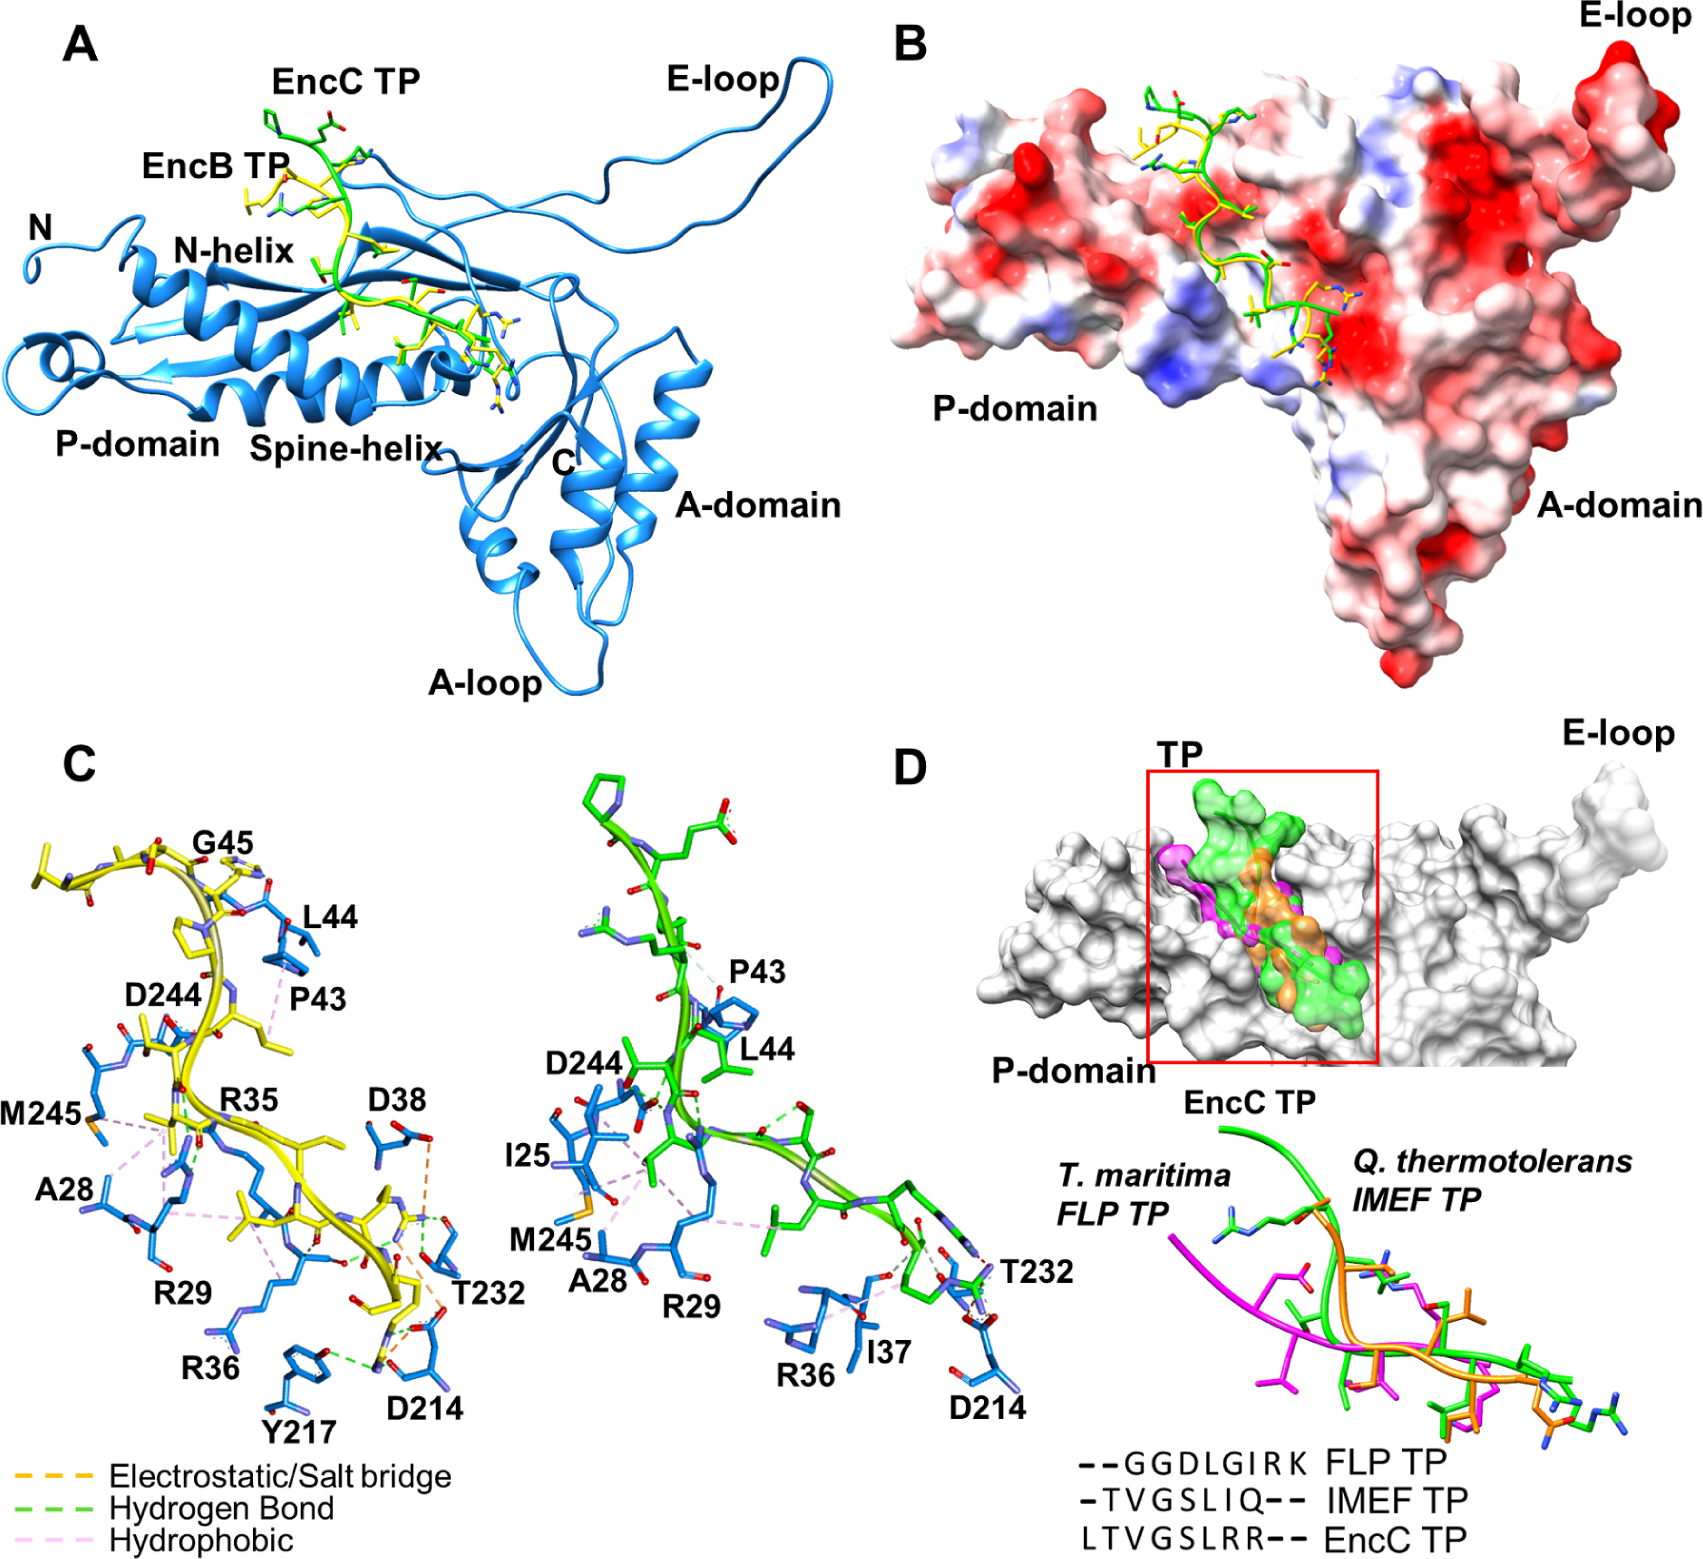
Figure 3.

Locations of TP binding sites on an EncA monomer. (A) EncB TP (yellow) and EncC TP (green) located on EncA (blue). (B) EncB TP and EncC TP shown on EncA surface colored according to the electrostatic surface potential (blue: electropositive, red: electronegative and white: neutral). (C) Close-up views of EncB TP (left) and EncC TP (right) binding pockets. Electrostatic interactions and salt bridges are represented as orange dashes, hydrogen bonds are shown as green dashes and hydrophobic interactions are shown as pink dashes. (D) Structural comparison of TPs from different organisms. Surface representations of TPs from M. xanthus EncC (green), T. maritima FLP (magenta) and Q. thermotolerans IMEF (orange) located on shell protein (gray) are shown on top. Superimposed structures and sequence alignment of TPs are shown at the bottom. See also Figure S5 and Figure S6.
