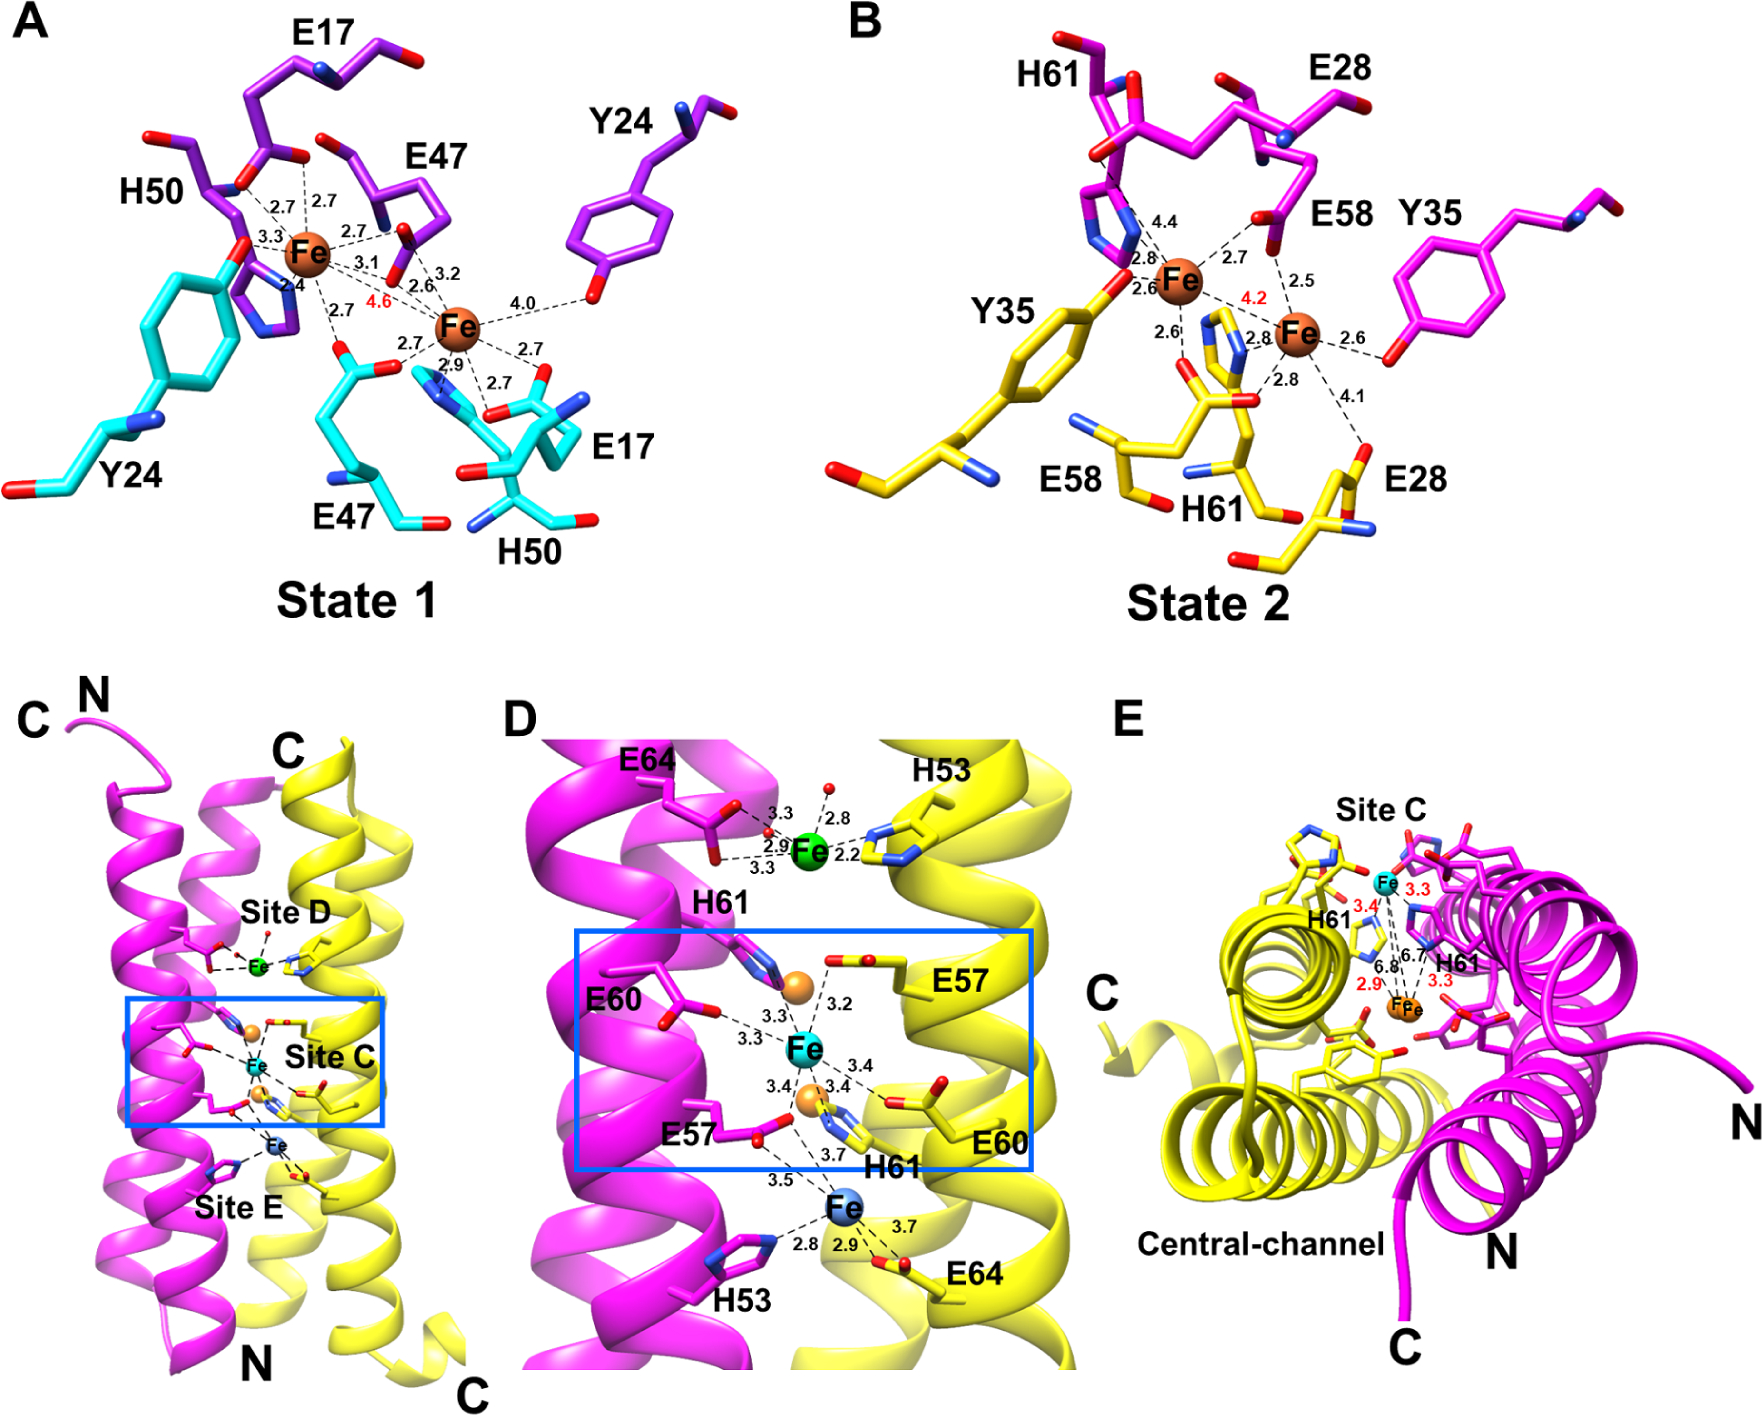
Figure 6.

EncB and EncC ferroxidase centers (FOCs). (A) Diiron binding site of EncC showing Fe+2 coordination in “state 1” which is the equivalent of iron coordination shown in other encapsulated ferritin structures. (B) Diiron binding site of EncB showing Fe+2 coordination in “state 2”. Coordinating residues in the FOC from each α-helix are shown in purple and cyan for EncC, and magenta and yellow in EncB. Fe atoms are shown as orange spheres. Distances between Fe atoms and the coordinating residues are shown as black dashed lines. A red label shows the distance between two Fe atoms. (C) Additional metal binding sites formed by the glutamic acid-histidine ladder in EncB as viewed from outside. EncB monomers are colored in magenta and yellow. The “site C” Fe atom is shown as a cyan sphere, while the loosely coordinated Fe atoms in “site D” and “site E” are shown as green and blue spheres, respectively. (D) Close-up view of the EncB additional metal binding sites. Distances between Fe atoms and coordinating residues are shown as black dashes. (E) EncB site C and FOC as observed along the axis of the α-helices. Site C Fe is colored in cyan while the FOC Fe atoms are colored in orange. Distances are shown as black dashes. Distances between the bridging histidine residues and the Fe atoms are labeled in red. Distances between the site C Fe and FOC Fe atoms are labeled in black. See also Figure S7 and Figure S8.
