
Figure 7.
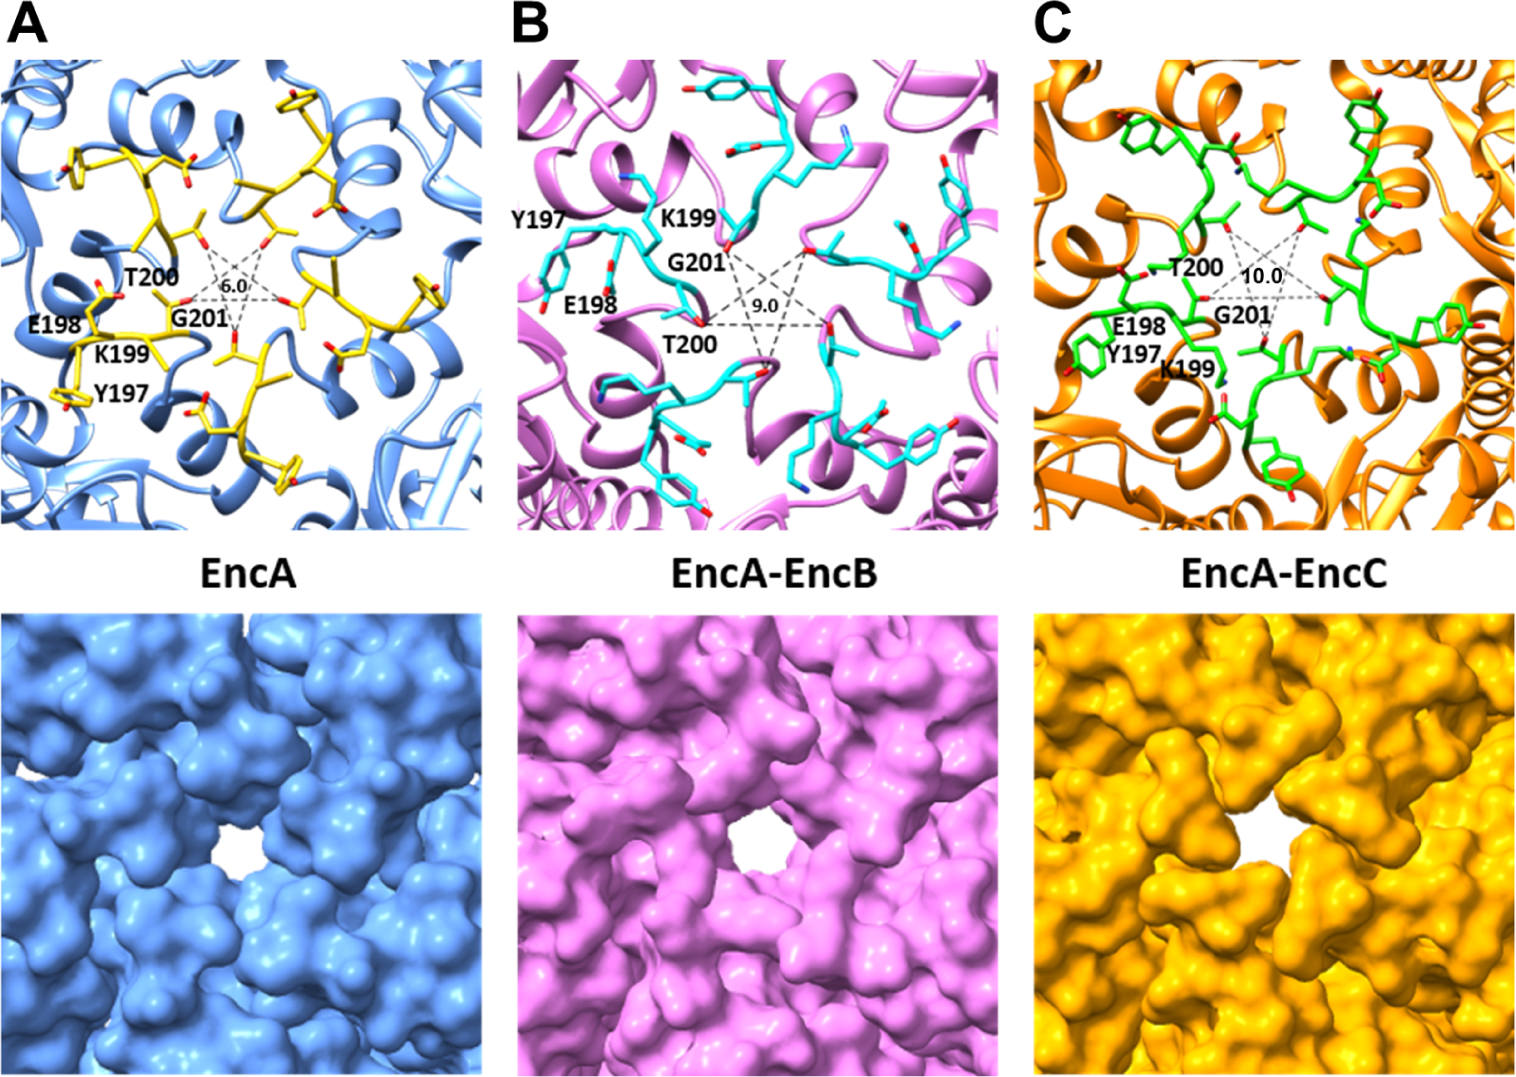
Analysis of the EncA pores at the 5-fold-axis. Close-up views of the (A) EncA (blue), (B) EncA-EncB (pink) and (C) EncA-EncC (orange) shell at the 5-fold-axis showing the pores. Top panels show the cartoon representations where the pore-surrounding residues are shown as stick models. Bottom panels show the surface representations of the shell proteins. The sizes of pores, in Å, are shown in the centers of the upper panels. See also Figure S9.