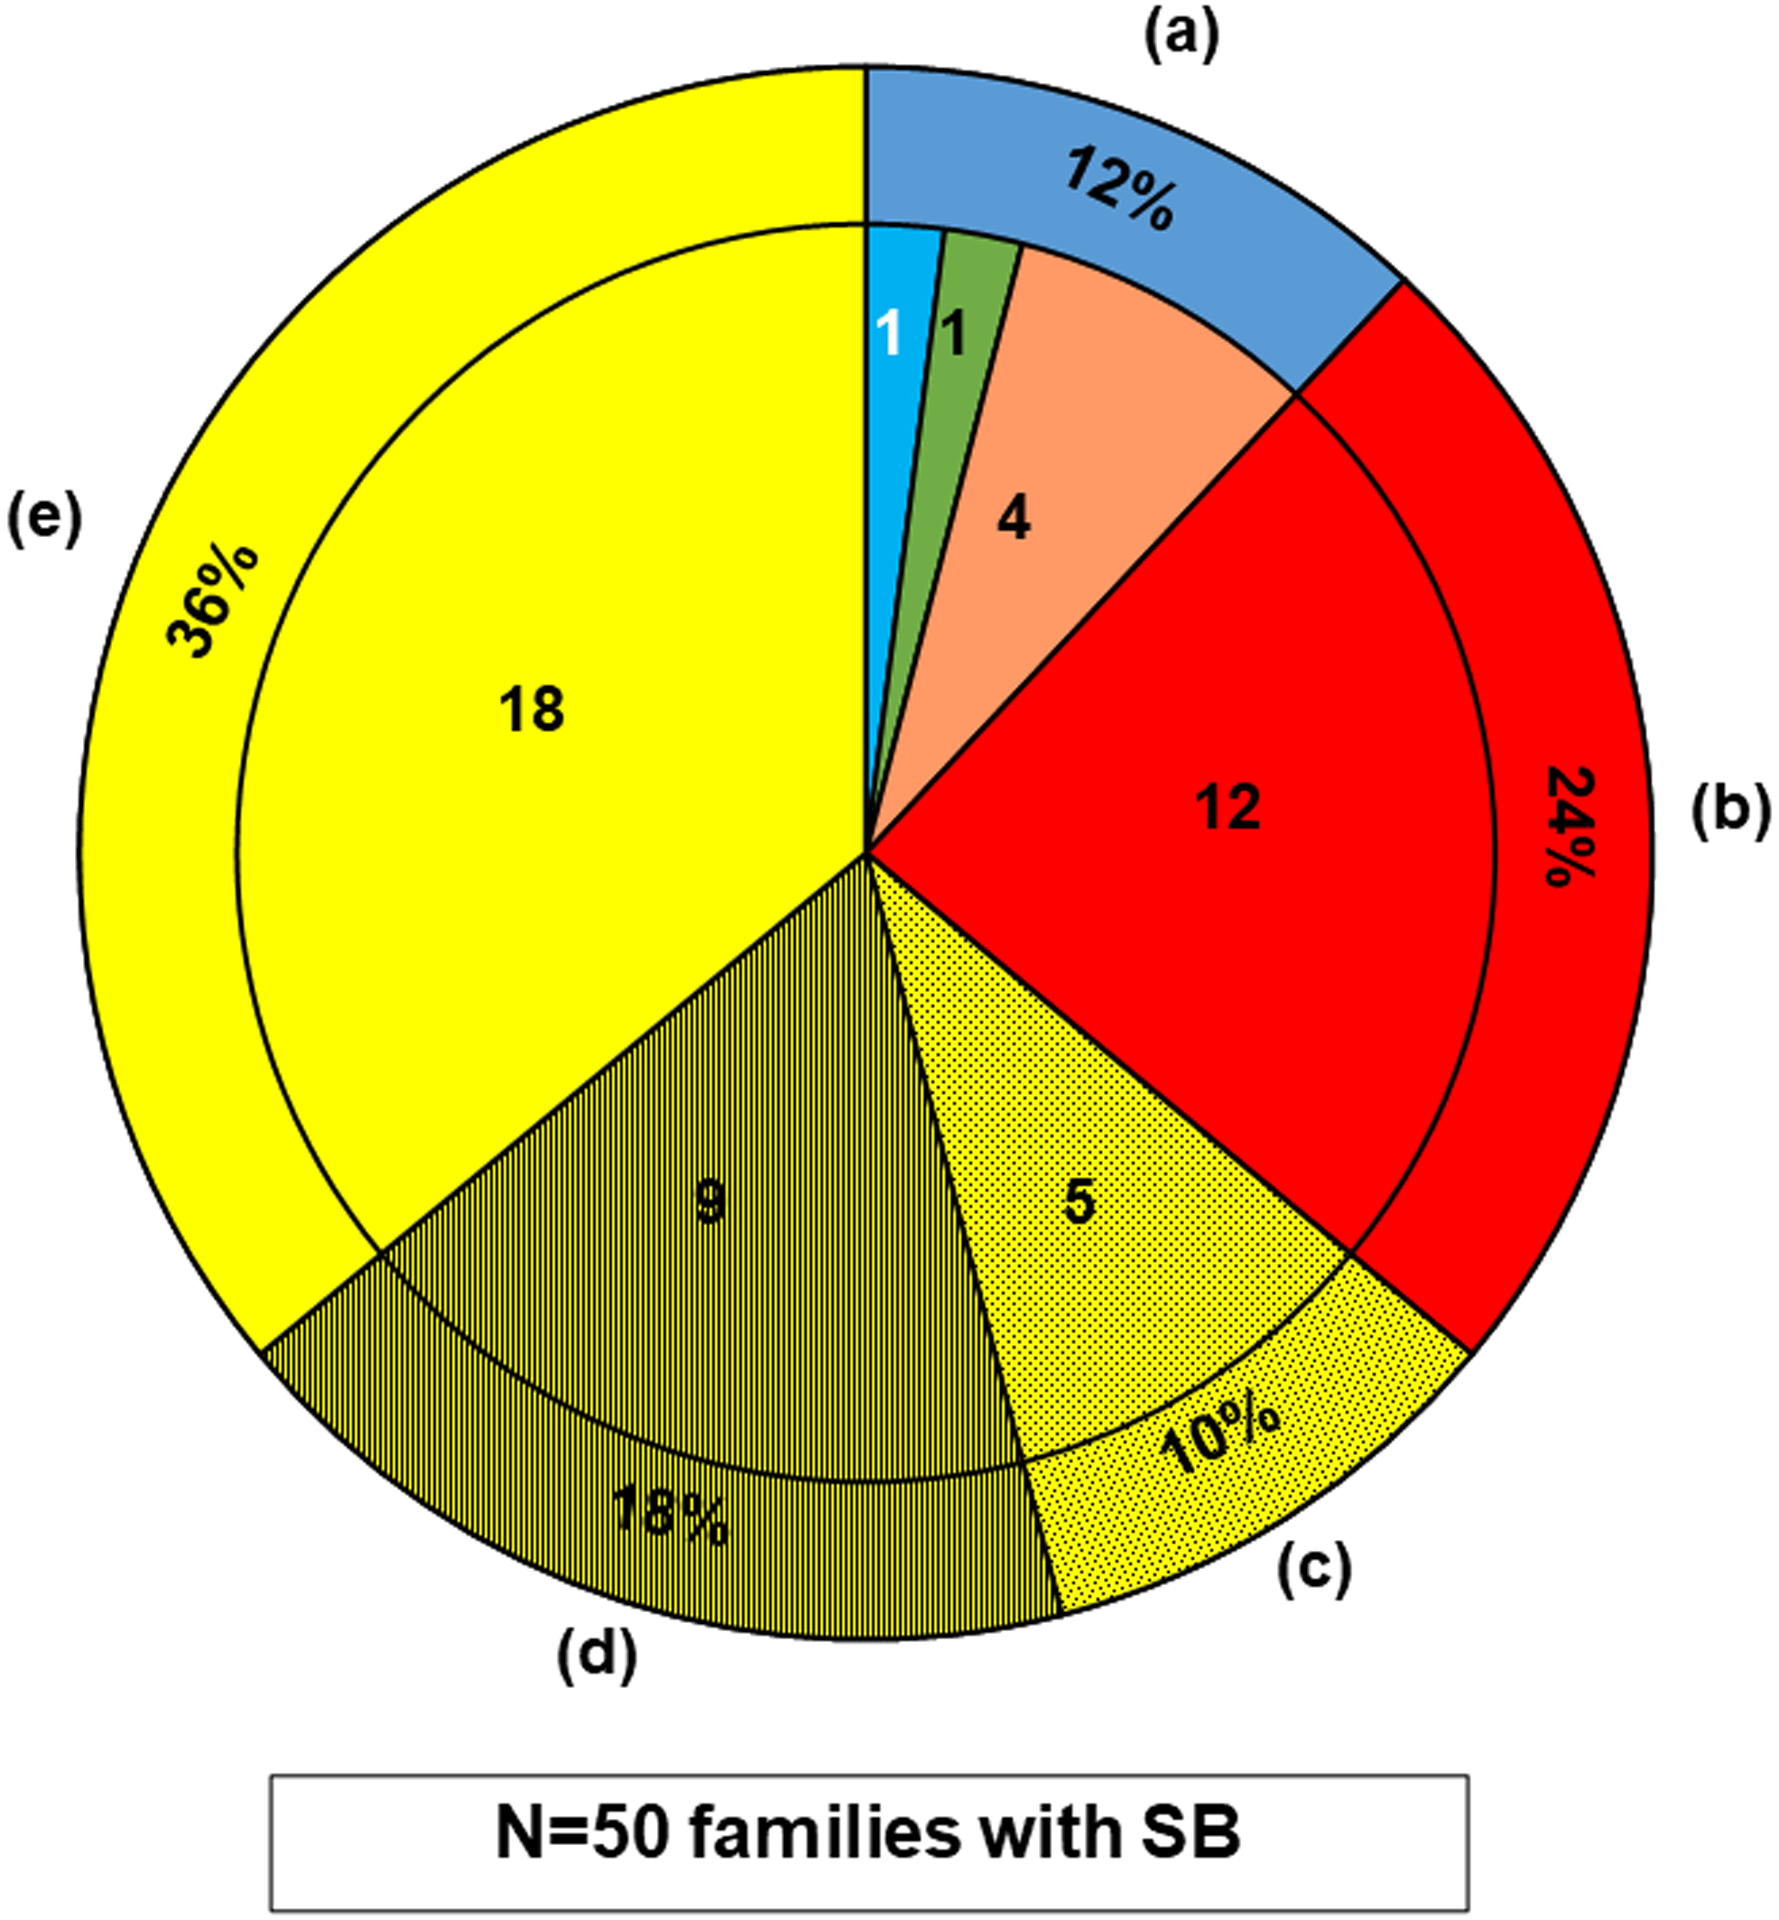
Figure 2. WES in 50 cases with SB identifies 6 potential SB genes from 136 potential candidate genes and 12 potential novel SB genes from unbiased WES analysis.

Whole exome sequencing (WES) data of 50 affected individuals with SB from 50 unrelated families was analyzed for likely deleterious variants in the candidate genes assumed to cause, if mutated.
The outer ring shows the percentage, and the inner segments shows the number of families for the 50 SB cases.
The pie chart summarizes the findings for all 50 SB cases, which is divided into the following subgroups:
(a)The outer ring dark blue segment denotes the 6/50 (12%) cases, in whom a likely deleterious variant in one of the potential SB candidate genes we generated was detected (Table 1). The inner sub-segments show a breakdown of these genes by their origin from the predefined candidate gene lists (Tables S2–S5), it shows that a likely deleterious variant was detected in an SB candidate gene (see Fig.1) in 6 cases (12%), i.e., 4 variants in mouse SB candidate genes (orange); and 1 variant in a candidate gene known to potentially cause human non-syndromic SB (light blue); and 1 variant in a potential candidate gene known to cause a human syndrome with facultative SB (green).
(b)The red segment denotes the 12/50 (24%) cases, in whom a likely deleterious variant in a potential novel gene was detected by WES (Table 2).
(c)The dotted yellow segment denotes the 5/50 (10%) cases, in whom likely deleterious variants in more than one gene were identified without a preferred candidate, leaving them inconclusive (Table S7).
(d)The hatched yellow segment denotes the 9/50 (18%) cases, in whom likely deleterious variants in a single candidate gene were detected, but negative reverse phenotyping, conflicting segregation analysis, or a comparable burden in our in-house control cohort (Table S8) rendered them unlikely deleterious.
(e)The clear yellow segment denotes the 18/50 (36%) cases, in whom no likely deleterious variant was detected
