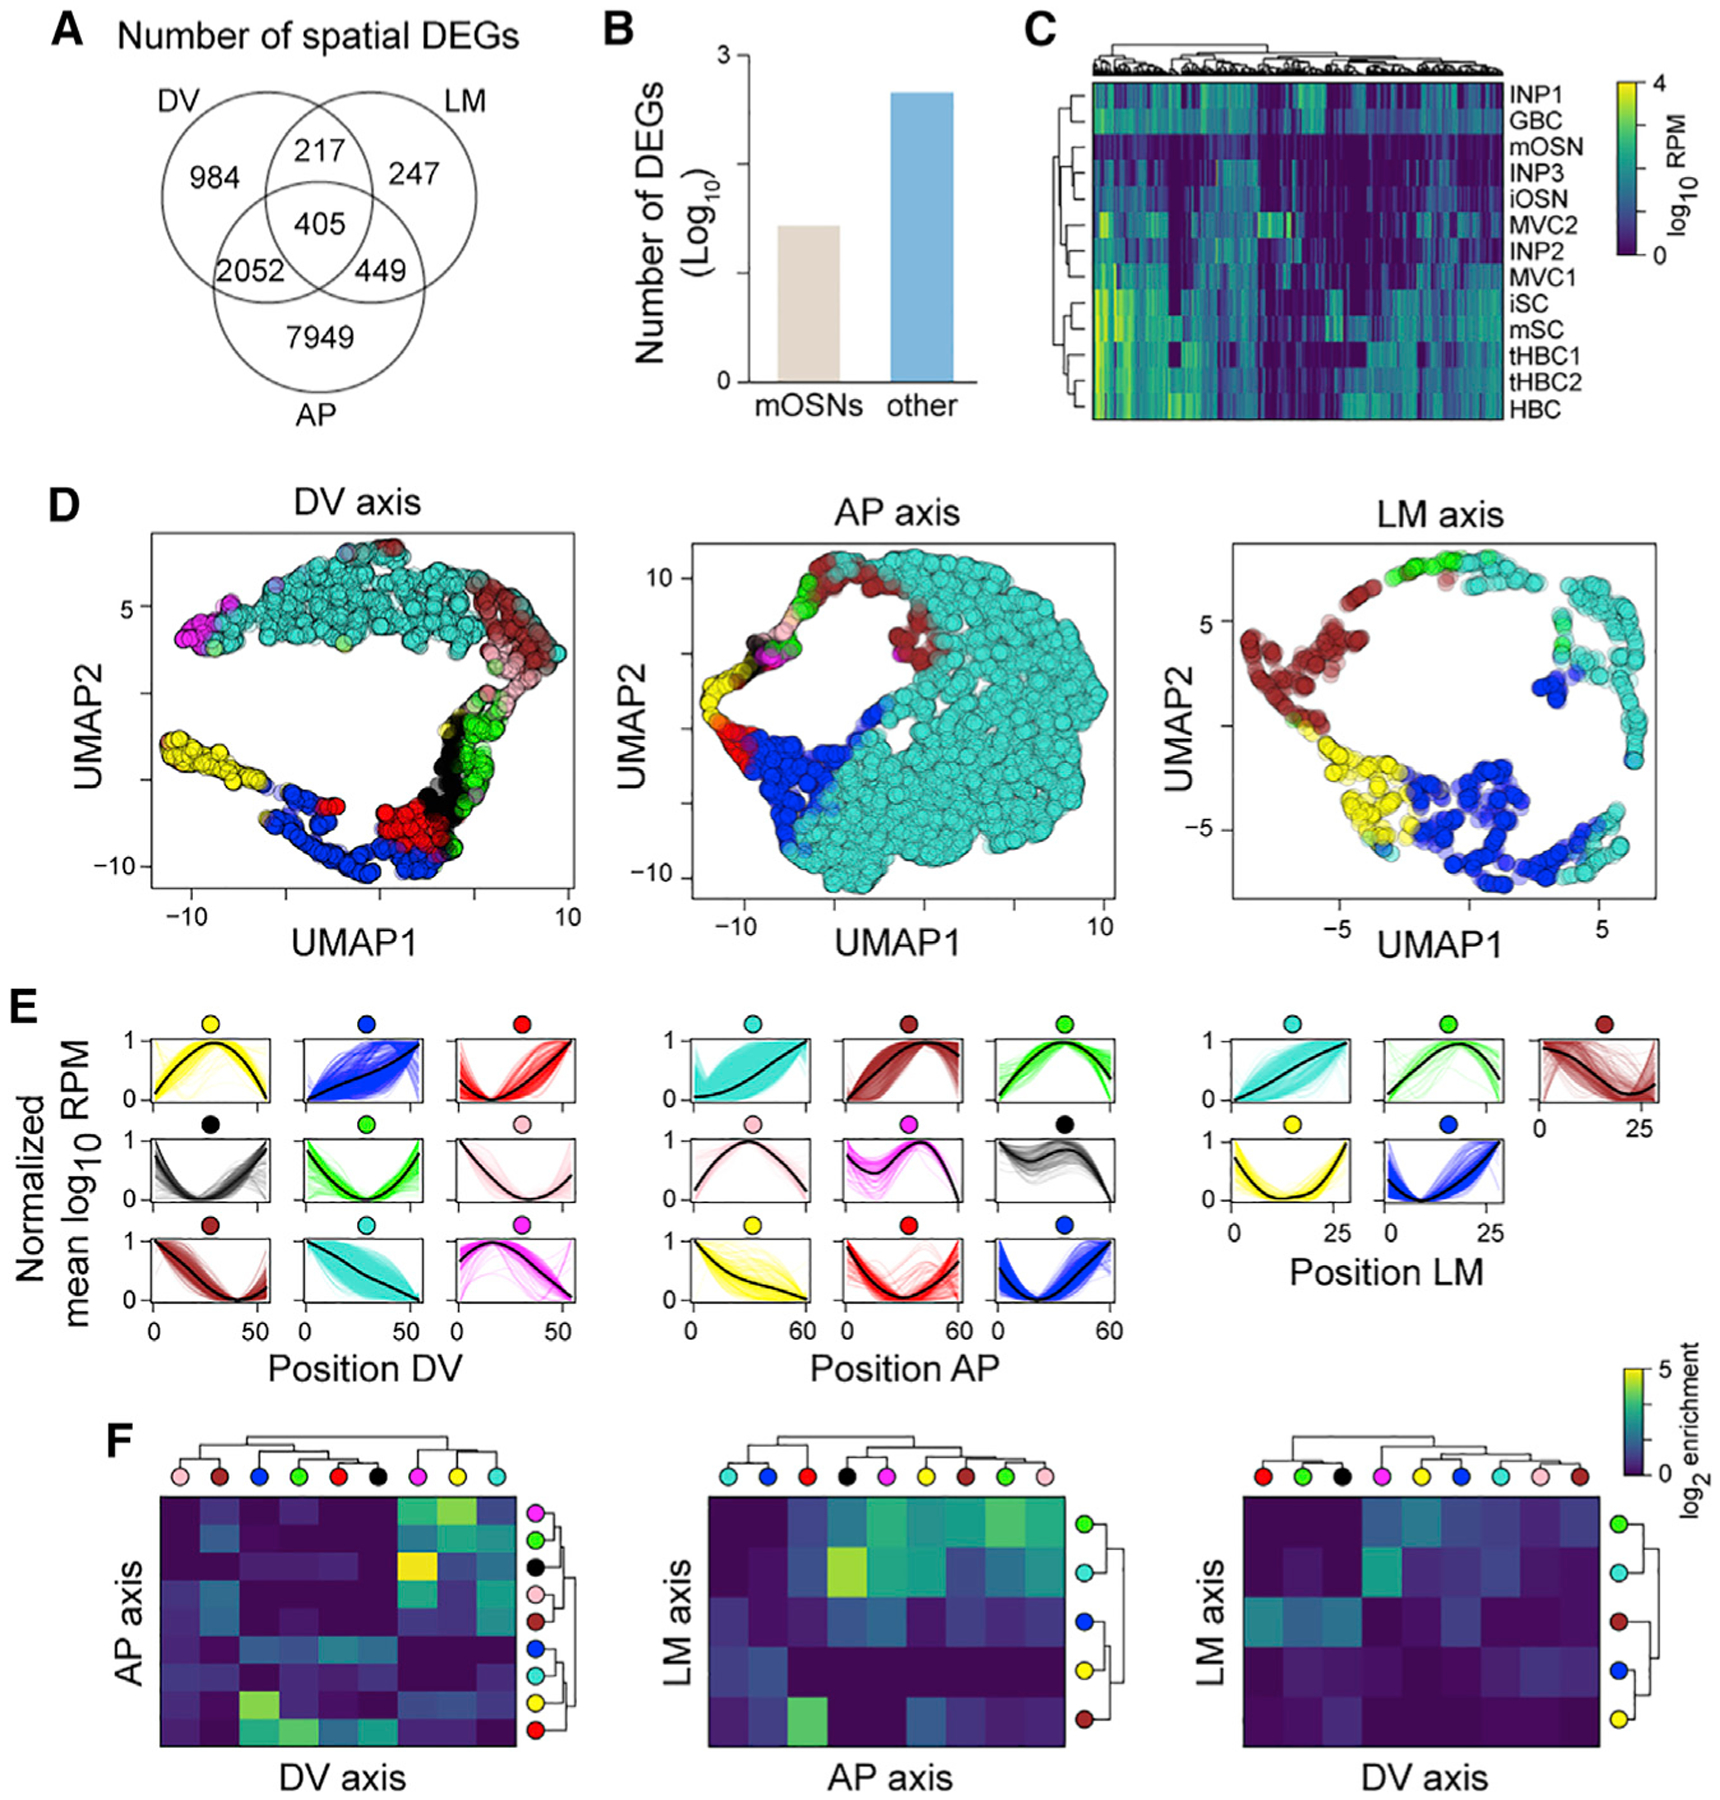
Figure 2. Genes with non-random spatial patterns across different cell types in the OM.

(A) Venn diagram showing the numbers of spatial differentially expressed genes (DEGs) along each axis.
(B) Bar plot showing the log10 number of spatial DEGs that are mOSN specific (“mOSNs”) or that are detected only in cell types other than mOSNs (“other”).
(C) Heatmap of log10 mean expression per cell type of genes that are not expressed in mOSNs but only in other OM cell types (INPs, immediate neuronal precursors; iSCs, immature sustentacular cells; mSCs, mature sustentacular cells; MVCs, microvillous cells; mSCs, mature sustentacular cells).
(D) UMAP plots of spatial DEGs along the three axes (n = 3 per axis). Each gene is colored according to the cluster it belongs to.
(E) Normalized average expression patterns of spatial DEGs clusters along the three axes.
(F) Heatmap showing the log2 enrichment over the random case for the intersection between lists of genes belonging to different clusters (indicated by colored circles) across pairs of axes.
