Figure 1:
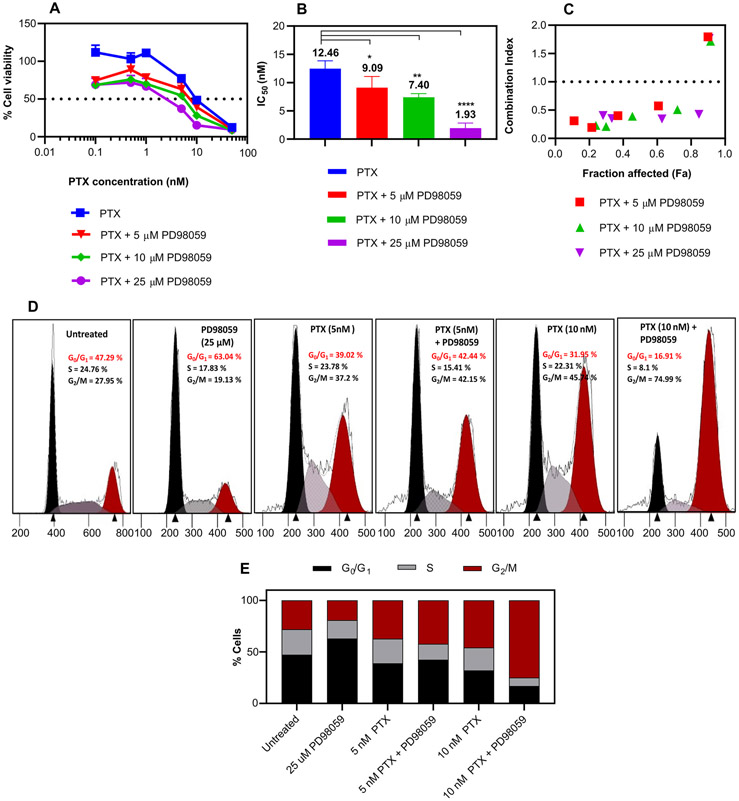
Cytotoxicity study of PTX +/− PD98059. (A) Cell viability study of Hec50co cells cultured with increasing concentrations of soluble PTX +/− indicated concentrations of PD98059 for 72 hr and measured using an MTS assay. (B) IC50 of PTX with various PD98059 concentrations. (C) Synergy between PTX and PD98059, where the CI was plotted versus fraction affected (Fa) where CI values < 1 indicate synergy. (D) Cell cycle profiles of Hec50co cells treated with 5 and 10 nM PTX, and 25 μM PD98059 or their combination for 24 hr and (E) representative histograms of the percentages of the cells that were in each phase. Results are reported as mean ± SD (n = 3). Statistical analysis was performed using one-way ANOVA; **** P < 0.0001, ** P < 0.01, * P < 0.05.

