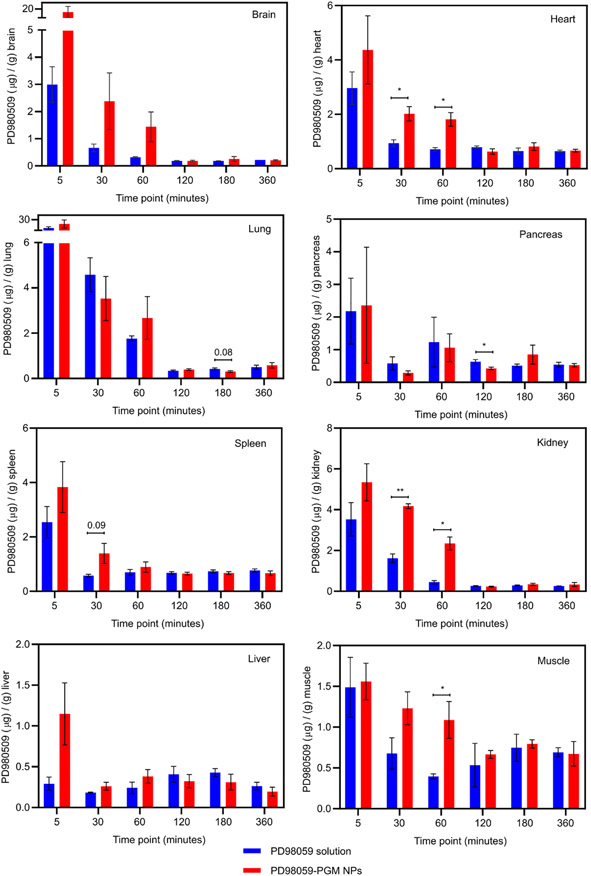
Figure 3.
Biodistribution of PD98059 for each organ 5, 30, 60, 120, 180 and 360 minutes after injection displaying the PD98059 accumulation/g of indicated organ. The amount of PD98059 for each organ was measured using HPLC-UV. Student’s T-test was used to compare accumulation of PD98059 (resulting from soluble PD98059 versus PD98059-PGM NP delivery) in a specific tissue at a specific time point. Where p values were between 0.05 – 0.1, the values are shown (indicating a possible trend) while p-values > 0.1 are not shown in the graph; * p < 0.05 and ** p < 0.01. Results are reported as mean ± S.D. (n = 3).

