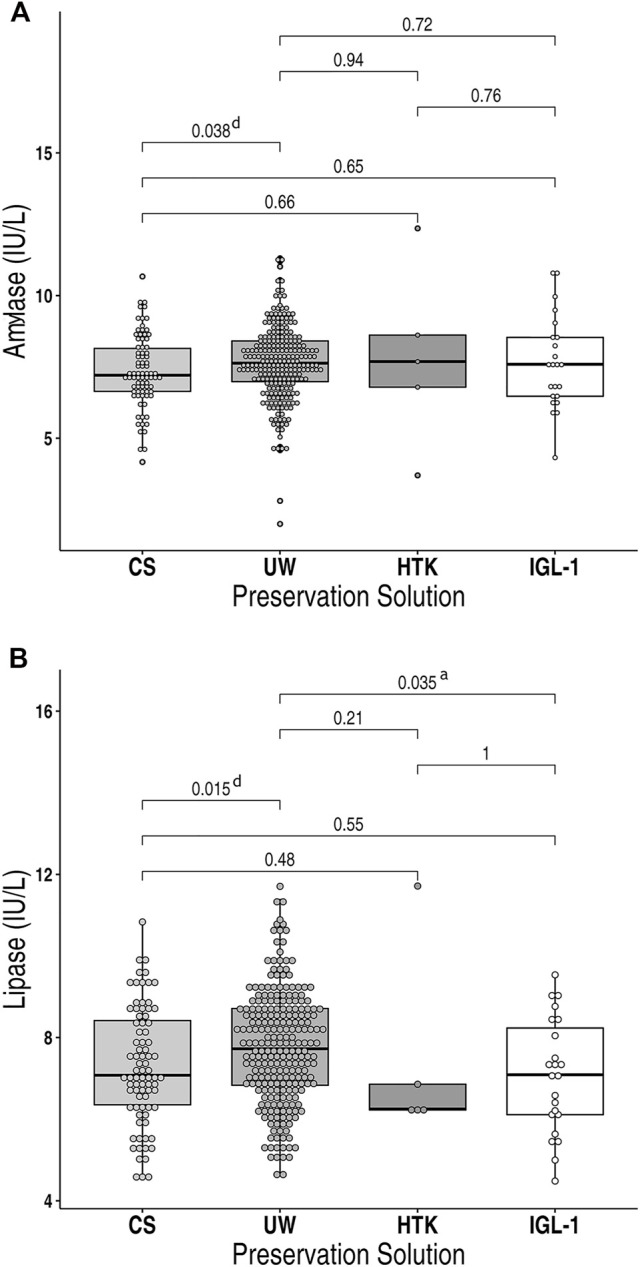
FIGURE 1.

Box Plot showing (A) post-transplant serum amylase levels and (B) post-transplant serum lipase levels in recipients of pancreas allografts preserved in either CS, UW, HTK or IGL-1 preservation solution. Measured values were converted into logarithmic values. Boxes represent the interquartile ranges and whiskers extend to the minimum and maximum values. The median values are shown within the boxes. UW, University of Wisconsin; CS, Celsior; HTK, Histidine-Tryptophan-Ketoglutarate; IGL-1, Institut Georges Lopez-1. aIGL-1 vs. UW; dCS vs. UW.
