FIGURE 2.

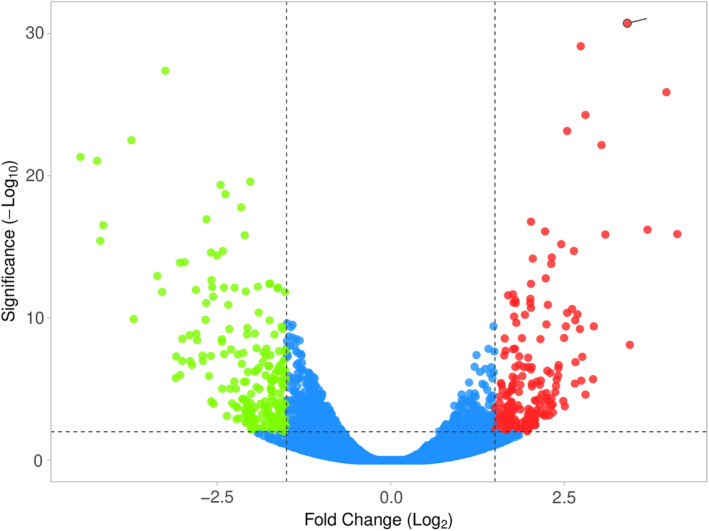
Volcano plot of differentially expressed lncRNAs. Upregulated and downregulated genes are represented by red and green dots, respectively. The blue dots represent no significant genes (at adjusted p < 0.05)

Volcano plot of differentially expressed lncRNAs. Upregulated and downregulated genes are represented by red and green dots, respectively. The blue dots represent no significant genes (at adjusted p < 0.05)