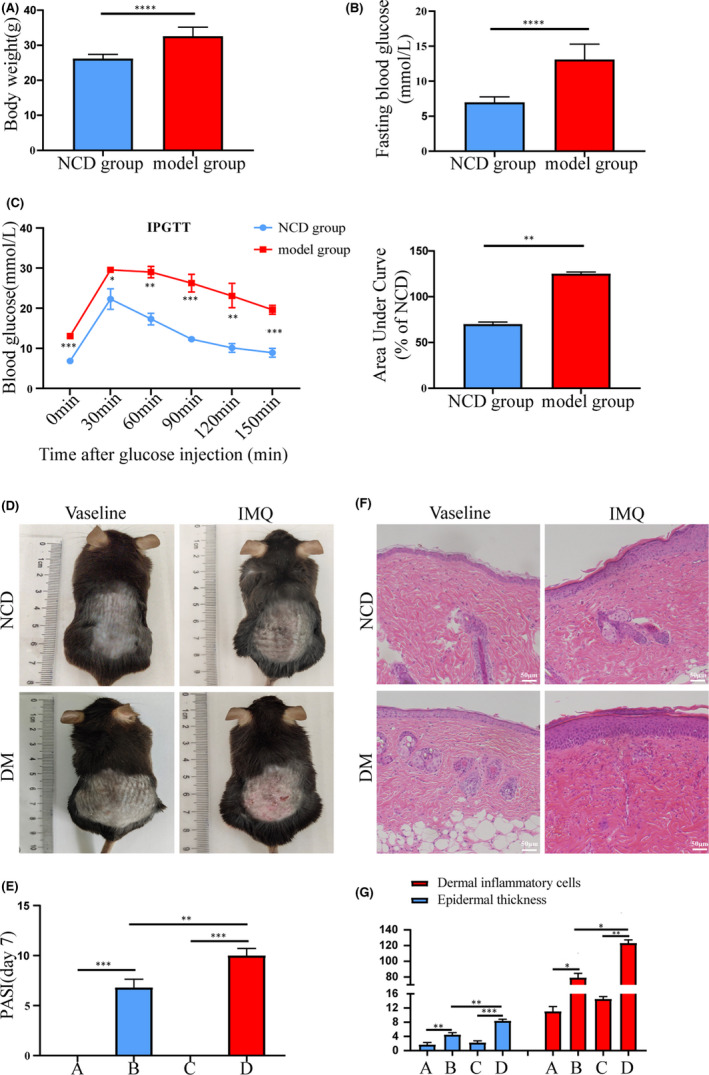
FIGURE 2.

Clinical parameters of psoriasis and T2DM animal model. Group A, NCD + Vaseline, Group B, NCD + IMQ, Group C, DM + Vaseline, Group D, DM + IMQ. T2DM mouse model was induced by high‐fat diet (HFD) combined with low‐dose streptozotocin (STZ), the body weight (A) and fasting blood glucose (B) of mice in the NCD group were compared. Intraperitoneal glucose tolerance test (IPGTT) (2 g/kg) was evaluated by measuring the blood glucose levels of the tail vein and area under the curve (AUC) (C). After 7 days of intervention with IMQ, (D) visual changes in the skin on the back of each group, (E) comparison of PASI scores of back skin of mice in each group. (F) Histopathological changes were observed under light microscope after HE staining (×200). (G) The epidermal thickness and the number of inflammatory cells in the dermis were analysed by Image‐Pro Plus 6.0 software. Data are represented as means ± SEM (n = 6). *p < 0.05; **p < 0.01; ***p < 0.001; ****p < 0.0001; Scale bars, 50 µm
