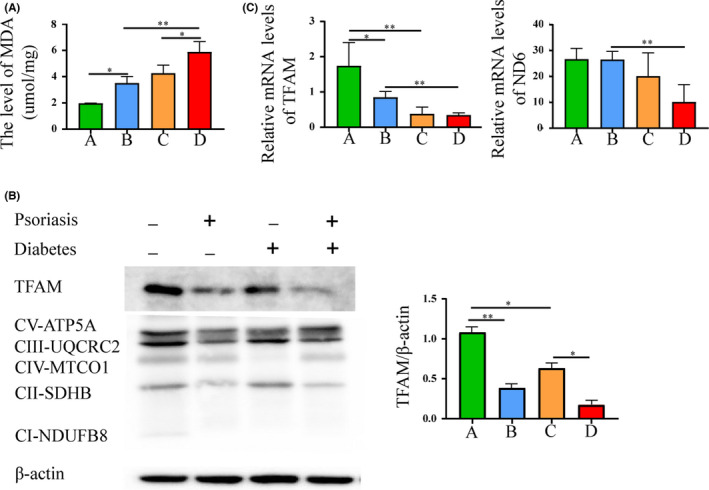
FIGURE 4.

Correlation of STING‐IRF3 pathway with mitochondrial damage. Group A, NCD + Vaseline, Group B, NCD + IMQ, Group C, DM + Vaseline, Group D, DM + IMQ. (A) The level of oxidative stress was measured by lipid peroxidation (MDA) assay. (B) The level of TFAM and mitochondrial OXPHOS proteins (CV‐ATP5A, CIII‐UQCRC2, CIV‐MTCO1, CII‐SDHB and CI‐NDUFB8) in skin tissue were measured by Western blotting. (C) Total mRNA levels of mitochondrial‐related genes TFAM, ND6 in skin tissue were measured by RT‐qPCR. Data are represented as means ± SEM (n = 6). *p < 0.05; **p < 0.01; ***p < 0.001; ****p < 0.0001
