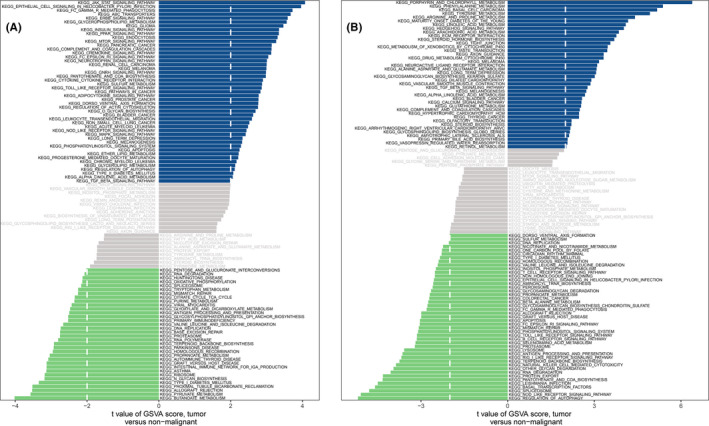
FIGURE 5.

High‐ and low‐expression groups based on the expression levels of each marker gene combined with GSVA in CBS (A) and HSPB1 (B)

High‐ and low‐expression groups based on the expression levels of each marker gene combined with GSVA in CBS (A) and HSPB1 (B)