
FIGURE 5.
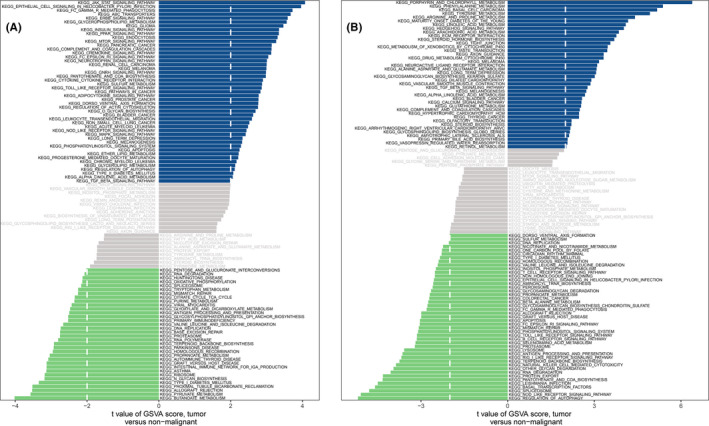
High‐ and low‐expression groups based on the expression levels of each marker gene combined with GSVA in CBS (A) and HSPB1 (B)
Official websites use .gov
A
.gov website belongs to an official
government organization in the United States.
Secure .gov websites use HTTPS
A lock (
) or https:// means you've safely
connected to the .gov website. Share sensitive
information only on official, secure websites.
High‐ and low‐expression groups based on the expression levels of each marker gene combined with GSVA in CBS (A) and HSPB1 (B)