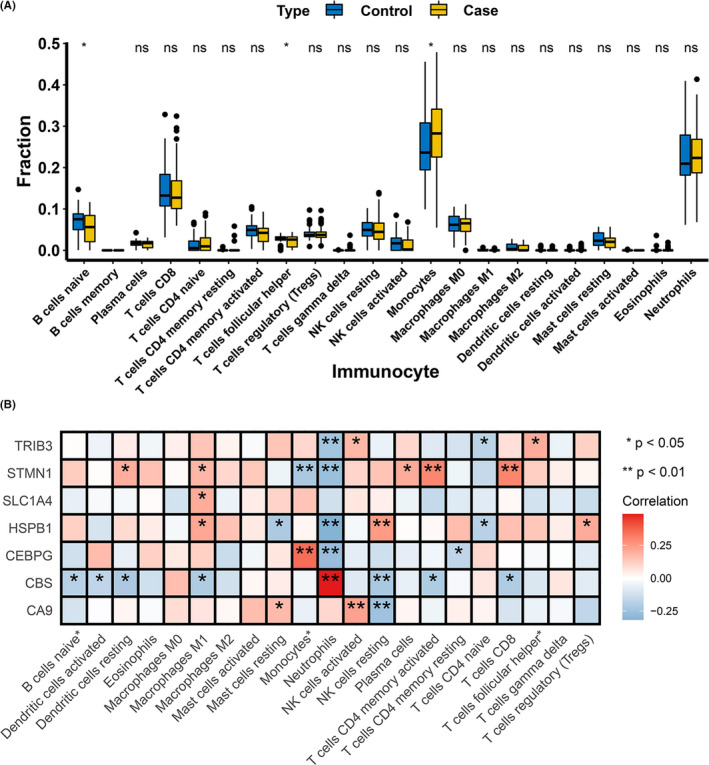
FIGURE 6.

Immune landscape analysis. (A) Implemented the CIBERSORT algorithm to explore the differences in the immune microenvironment between CAD patients and normal samples. (B) Pearson correlation analysis revealed that neutrophils had strong positive and negative correlations with CBS and HSPB1 respectively. CEBPG was positively correlated with monocytes (*p < 0.05, **p < 0.01)
